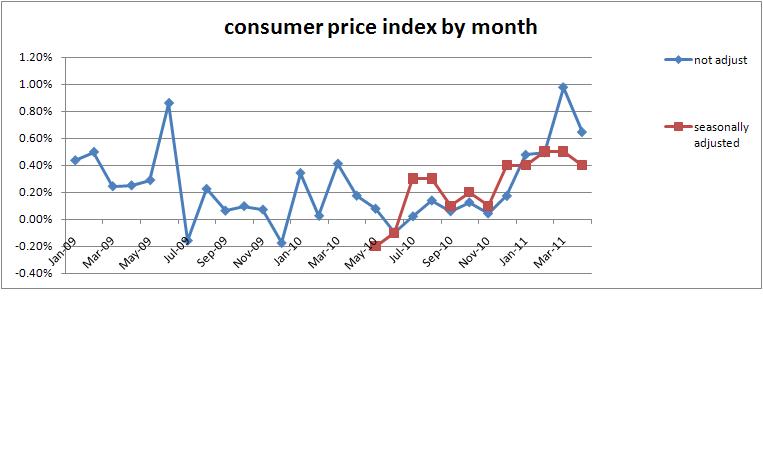
April inflation data is out. Adjusted for seasonal factors the increase was 0.4%. Without seasonal adjustment it was up 0.6%. That makes adjusted increases for last five months 0.4, 0.4, 0.5, 0.5, and 0.4. Not good numbers and a worse pattern. That’s a 2.2% increase in consumer prices in five months.
Put the data into a graph like last month. Also added the adjusted amounts. Here’s the graph:
