Same-Meal-at-the-Same-Restaurant price index. I don’t even want to calculate the increase for this meal.

My reaction every time I see the total on the grocery store cash register.
Image courtesy of Adobe Stock.

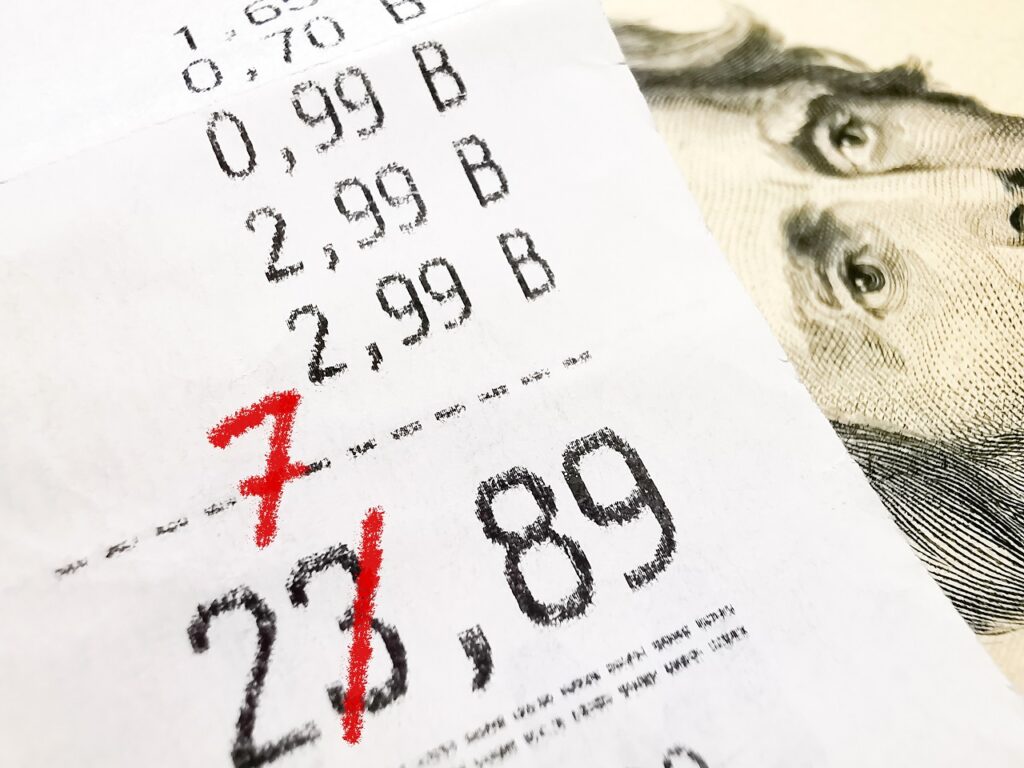
Before leaving California I provided several illustrations of the actual price increases at a specific restaurant for the identical meal. Since moving to Williston, North Dakota I don’t have a lot of good data points yet. We’re still going to different restaurants and ordering different items so I don’t have a useful point-to-point comparison.

Yesterday my son gave me a painful example.

Last March he ordered one foot-long sub sandwich, a 6 inch sandwich, and one soda.

The price?

$13.26.

Yesterday he ordered the exact same items from the same restaurant.

The price?

(more…)

15% increase in 8 months. Another entry for the Same-Meal-at-the-Same-Restaurant price index.

Image courtesy of Adobe Stock.

The size of a bite which inflation is taking out of every meal is accelerating for those of us who are not living at the top of an ivory tower fortress inside the D.C. Beltway.

Got lunch from Jimmy John’s yesterday. They fix up yummy sandwiches. 

I had turkey on French bread with provolone cheese. Split a large sandwich with my dining partner.  ‘Twas delish’.

Price was $14.99.  Yeah fifteen bucks for just the sandwich, to go, so nothing for the greedy state tax machine.

Last August the exact same sandwich was $12.99. Up an even $2.00.

(more…)

Same-Meal-at-the-Same-Restaurant price index increases 12% in 5 months. Oh, and a less tasty meal.

Image courtesy of Adobe Stock.

For another data point of inflation experienced by consumers, let’s consider the holiday meal at a restaurant here in Rancho Cucamonga.  Consider the contrast with the official CPI measurements.

This is third discussion on the same-meal-at-the-same-restaurant price index.

One of the nicer restaurants (perhaps nicer is only on my scale) in our area is called Mimi’s. They offer a limited selection of meals on holidays which are nicer than their usual entrée. Today two of the five main choices were either ham or turkey with identical side dishes of mashed potatoes, cornbread dressing, green beans, choice of three appetizers, and choice of three desserts.

On Thanksgiving Day 2021 the meal cost was $25. On Easter day 2022 the meal cost was $28.

That is a $3 increase.

(more…)

Producer Price Index up 0.8% in February 2022 with January revised upward from 1.0% to 1.2%.

The Producer Price Index (PPI) rose 0.8% in February.   The previously reported 1.0% rise in January was revised to 1.2%. So that is actually a cumulative increase of 1.0% in February

Keep in mind the prior monthly increases PPI are revised as needed. This is in contrast to CPI which is not revised.

In February, core PPI, without food, energy, & trade, was up 0.2% in February with January revised downward from 0.9% to 0.8%.

For background, the Bureau of Labor Statistics provides a description of PPI:

“The Producer Price Index (PPI) is a family of indexes that measures the average change over time in selling prices received by domestic producers of goods and services. PPIs measure price change from the perspective of the seller. This contrasts with other measures, such as the Consumer Price Index (CPI), that measure price change from the purchaser’s perspective. Sellers’ and purchasers’ prices may differ due to government subsidies, sales and excise taxes, and distribution costs.”

So the PPI measures prices received by producers for their goods and services. Those costs roll into the goods and services you and I buy as end consumers.

This means the increases in wholesale prices, which show a lot of inflation, are heading our way as those increases work themselves into the CPI.

Graph at the top of this post shows the monthly price change for total demand with separate line for total demand goods and total demand services.

With revisions, the year over year increase in PPI is 10.0% in February and January, which is only a slight increase from 9.9% in December and November and the increases were just under 9.0% for October back to August.

Take a look at the year over year change in final demand and core change which means without food, energy, and trade.

(more…)

High inflation rates likely to continue for remainder of 2022.

Image courtesy of Adobe Stock.

It is looking like we are going to see high inflation numbers for a while, probably least all of 2022.

Mentioned yesterday the CPI increase of 7.9% in a year hit a 40 year record.

Treasure Secretary’s expectations.

In an interview on 3/10/22, Treasury Secretary Janet Yellen said the inflation numbers are going to be uncomfortable for the rest of 2022.

Fox Business is one source that covered her comments on 3/10/22: Treasury Sec. Yellen contradicts Psaki: Likely to see another year of ‘very uncomfortable’ inflation.

The money quote:

(more…)

Consumer Price Index increases 0.8% in February 2022. One year increase highest since January 1982.

The Consumer Price Index (CPI) increased 0.8% in February 2022 after increasing 0.6% in January, 0.5% in December 2021, and 0.8% in November.

That is 1.9 % for the last three months.

Graph at top of this post shows the monthly increase in the all-items index along with the core change, which excludes food and energy. Graph also shows an average of the preceding 12 months for the all-items indicator.

The 12 month cumulative change continues to skyrocket. The monthly change in all items index and the cumulative change for 12 months looks as follows:

(more…)

Record high inflation is going to continue and likely get worse.

Image courtesy of Adobe Stock.

There are a lot of indications the inflation rates we’ve seen in the last year or so are going to continue. My guess is we will see higher inflation in the next year than we did in 2021. Author of the article discussing PPP says he expects a shock in the CPI sometime in the next few months.

Merely a few recent items pointing towards sustained and even increasing inflation:

  • Dollar Tree is now $1.25 Tree.
  • Experienced farmer describes how severely inflation is hitting his operations. Those increases are going to appear on the store shelves soon.
  • Producer Price Index is accelerating. Indications that unprocessed and intermediate goods are going up far faster than what we’re seeing at retail, so expect accelerating inflation.
  • Unusually high lumber prices are back.
  • Decent prices on cars will be harder and harder to find.

Dollar Tree is now Dollar and a Quarter Tree – Bought a couple items at Dollar Tree. They all rang up at $1.25. Glanced around the store noticing all the signs said $1.25.I asked the clerk about it and he said everything in the store is now a dollar and a quarter.

(more…)

Number of people drawing unemployment continues to improve, but very slowly, as of the start of November 2021.

The number of new claims for unemployment is slowly declining.

For the week ending 11/6/21 there were 267,000 new claims. While this is encouraging progress, keep in mind the number of people who are getting laid off is still far above the average of 212,000 per week all the way back in January and February 2020. We are still seeing more people laid off every week than before the pandemic began.

Here is a recap of newly unemployed over the last several months:

(more…)

Consumer Price Index increases 0.9% in October for the second time in 2021.

The Consumer Price Index (CPI) increased 0.9% in October 2021 after a more modest 0.4% increase in September and 0.2% in August.

The October increase matches the June increase of 0.9% and is slightly higher than April increase of 0.8%.

Diving into the components of the CPI shows the increases are broader than several months ago.

The press release from the Bureau of Labor Statistics explains:

“The monthly all items seasonally adjusted increase was broad-based, with increases in the indexes for energy, shelter, food, used cars and trucks, and new vehicles among the larger contributors. The energy index rose 4.8 percent over the month, as the gasoline index increased 6.1 percent and the other major energy component indexes also rose. The food index increased 0.9 percent as the index for food at home rose 1.0 percent. “

Warning sign as we roll into winter is fuel oil increased 12.3% in October and utility gas increased 6.6%. Keep in mind those are changes for the month, not for the year.

(more…)

What’s likely to happen with inflation? More of it and for extended time.

Rising costs and constrained shipping capacity is driving inflation and disrupting supply chain across the economy. Image courtesy of Adobe Stock.

Indicators I can see suggest inflation is going to continue at a high rate for quite some time.

This is a bigger issue for charities that for businesses.

For charities, inflation will push up the expenses of performing ministry and providing help to those in need.

Simultaneously, it will put pressure on donors because the money they have left over after rent, groceries, and gasoline will be shrinking. That will put pressure on contributions. Charities cannot push through an increase in contributions like a business can push through increase in prices.

Here are a few of the articles I have read recently pointing towards ongoing rise in prices:

  • Rent component of CPI will increase substantially over the next year because of the way the index is calculated.
  • Shipping costs have already skyrocketed.
  • Multiple food producers are struggling with rapidly increasing costs.
  • Major food producer expects their costs go up 11% in the next year with prices they charge to go up by 4%.
  • The phrase “stagflation” is back in play. Oh joy, a possible (likely?) return to the Carter administration.

Asia Times – 8/27/21 – US rent hikes will explode consumer inflation in 2022 – Anecdotal information indicates rental prices are skyrocketing.

A friend of mine priced the apartment they are living in to help a relative who was moving into the area. Price for this exact unit is 50% more than when they signed their annual lease a number of months ago.

An acquaintance reports the price for renting a particular house went up while they were thinking about it for a day or so.

Two friends report landlords renting apartments expect six months rent in advance and some landlords renting houses are expecting a year in advance. A year.

Article mentioned above says the reports floating around in the media indicate rent hikes overall are around 10%. Yet the CPI shows only 2% increase in rent.

How can that be?

Fascinating detail of how the CPI is calculated explains the anomaly and also points towards dramatic increase in the rent component of CPI over the next year.

(more…)

Expectations growing that we will see rising interest rates and sustained inflation.

Image courtesy of Adobe Stock.

It isn’t just the current numbers that are hinting that inflation is back. Changes in CPI and PCE are unsettling.

There is also a clear statement from the Fed they will nudge interest rates up earlier than they previous announced. Also indications from two big banks that we will see rising interest rates.

6/17/21 – Dailywire – Federal Reserve Delivers Bad News About Expectations For Inflation, Raising Interest Rates: Report – Previously the Federal Reserve indicated interest rates would not have to be increased until sometime in 2024.

(more…)

New claims for unemployment are flat and ongoing claims are slowly decreasing as of middle of June 2021.

New claims for unemployment are flat compared to three weeks ago. Ongoing claims for unemployment at the state and federal level are declining, slow though the decline may be.

Number of weekly new claims for unemployment was 406,000 three weeks ago and 412,000 the most recent week. The increase in the most recent week offset the decline in the previous two weeks.

Most recent data shows ongoing claims at the state level dropped from 3,602,000 three weeks ago to 3,518,000 in the most recent week, for a net decrease of 84,000. There was an increase two weeks ago, large drop last week, and essentially no change this week.

The number of new claims is still double the average from before the pandemic.

Purpose of these posts on economic statistics is to help all of us keep current on what is going on in the overall economy.

Revised number of weekly new claims in state programs over the last four months to show the trend:

  • 728K – 3/27/221
  • 590K – 4/24/21
  • 406K – 5/22/21
  • 412K – 6/12/21

Following graphs show the devastation from the economic shutdown.

New claims

New claims for unemployment by week since the start of 2020:

(more…)

Accelerating inflation rate continues in May 2021.

Changes in the Consumer Price Index have been making a splash in the news lately. Increases over the last three months have been unusually high.

The headline consumer price indicator increased 0.6% in May after 0.8% in April and 0.6% in March. That is a big run of inflation for three months.

The core measure, which excludes energy and food costs, has been on a roughly parallel track with 0.7 increase in May following a 0.9% in April and 0.3% in March.

Graph at the top of this page shows the change in the primary inflation indicator, and the core index along with a 12 month average of the monthly change.

You can see a large drop in prices during the pandemic followed by spikes over the next several months. Price changes returned to normal range in the September 2020 through February 2021 timeframe.

What is behind those numbers? Let’s check out the Wall Street Journal’s narrative:

(more…)

Monitoring inflation through the Personal Consumption Expenditure (PCE) price index.

Another way to keep track of inflation trends is by watching the price index for the Personal Consumption Expenditure.

Please journey along with me as I continue my education.

In the news yesterday was the April increase which showed a 3.1% year-over-year increase compared to an expectation of a 2.9% increase. For one article discussing the news, check out the following:

I have started to track this data, gathering information back to the start of 2020. The month by month change in the headline index and the core index (which excludes food and energy costs) can be seen in the graph at the top of this post.

Before look at the year-over-year change, we need to look at the nature of the index. There are two main indices used to monitor inflation. The first is the Consumer Price Index (CPI) which everyone knows about. The other is the Personal Consumption Expenditures (PCE).

What’s the difference? Great question.

(more…)

New claims for unemployment decreasing at end of May 2021. Ongoing claims are flat.

Since my last post on 4/30/20, a month ago, there has finally been visible progress in the number of people losing their job.

Since 4/24/21 the number of new claims for unemployment has dropped from 590,000 to 406,000 in the week ending 5/22/21. Graph above shows improvement. Average had been running around 800,000 from early October 2020 until late in February 2021.

The number of new claims is still double the average from before the pandemic. As recently as February it was four times, so that is progress. From quadruple for oh so many months to merely double is good. Not great for all those people losing their job now, but at overall level it is progress.

Purpose of these posts on economic statistics is to help all of us sort out what is going on in the overall economy.

Revised number of new claims in state programs over the last four months:

  • 754K – 2/27/21
  • 728K – 3/27/221
  • 590K – 4/24/21
  • 406K – 5/22/21

Following graphs show the ongoing human cost of the economic shutdown.

New claims

New claims for unemployment by week since the start of 2020:

(more…)