Headline unemployment rate drops another half percent in September 2020.

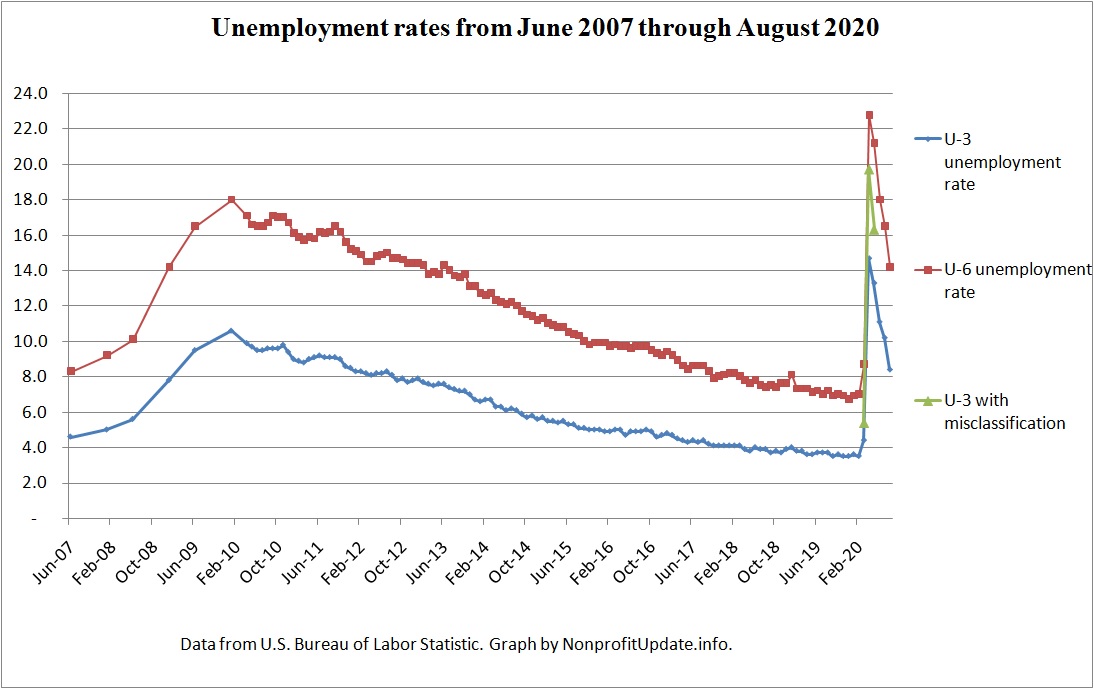
The unemployment rate dropped from 8.4% in August 2020 to 7.9% in September.

Amongst the extremes we are seeing during the shutdown, that 0.5% drop is the smallest monthly decline since the peak in April.

(Cross post from my other blog, Attestation Update.)

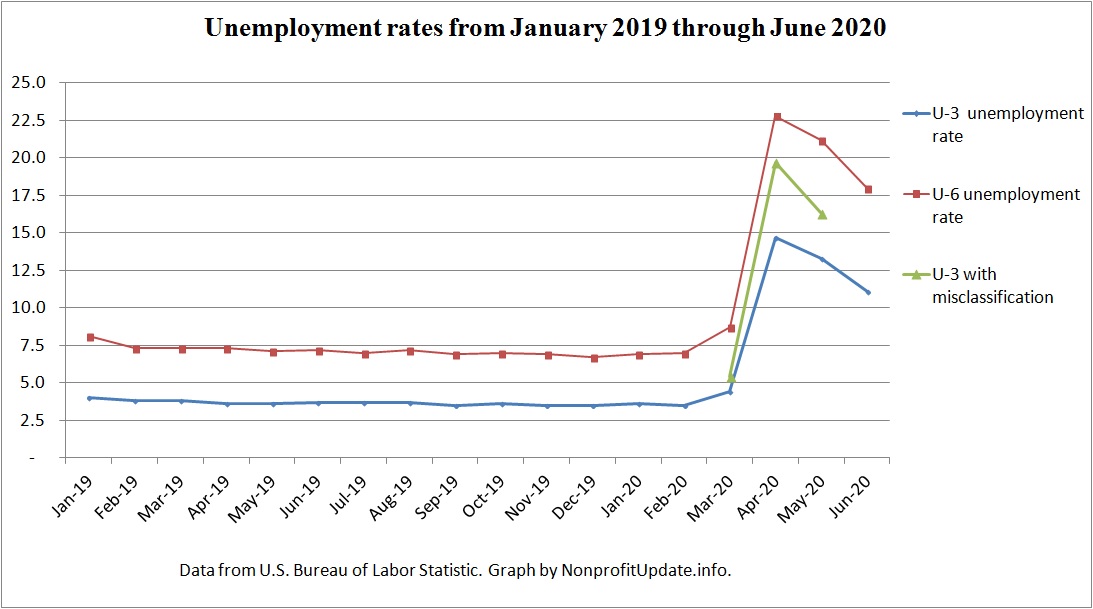
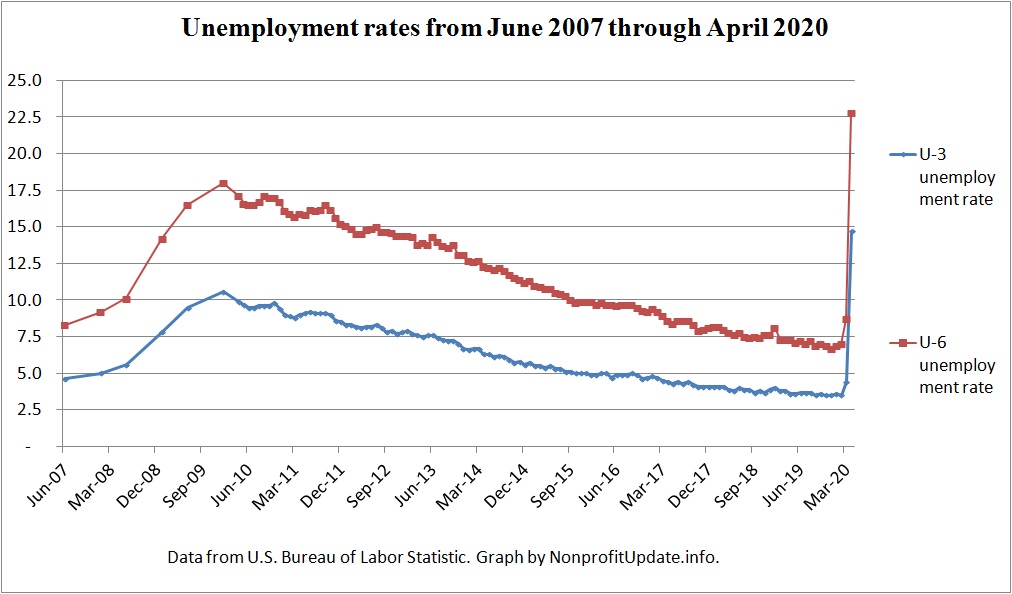
Check out the extreme swings in the U-3 unemployment rate over the last 7 months:

(more…)

Unemployment rate declines again in August 2020 after sharp spike in April 2020.

After shooting from 3.4% in February to 14.7% in April, the headline unemployment rate has dropped to 8.4% in August.

You will interpret the statistics as you wish.

Looks to me like people are slowing getting back to work after the shock of the pandemic and follow-on government-ordered shutdown of the economy.

There are six different measures of unemployment, each providing a slightly different perspective. Put them all together for a more complex picture the economy.

At the top is a graph since 2007 of U-3, the headline statistic, along with U-6, the broadest stat which includes discouraged workers, marginally attached, and those working part time because they can’t find full time work.

For a closer picture, focus in on the stats since January 2019:

(more…)

Headline unemployment rate drops by two percentage points in June 2020.

Wow, I sure don’t understand what is happening.  The headline unemployment rate declined 2.2% in June. That is a big drop.

At the same time, new claims for unemployment were 6.01 million for the four weeks ending 6/27/20. See previous post: New unemployment claims barely decline in week ending 6/27/20.

(How to put that information together? Well, the reason I’m blogging is to put my thoughts into writing, which forces me to think deeper in order to sort out what is going on around me.)

The U-3 unemployment rate in last four months with change from previous month:

march        4.4
april      14.7      10.3
may      13.3      (1.4)
june      11.1      (2.2)


That is a 2.6% drop in two months after a 10.3% rise in April.

Wow.

Graph above shows key unemployment rates since the start of 2019.

This discussion will be posted at several of my blogs.

For longer term perspective, consider the rates since before the Great Recession:

(more…)

Unemployment rate starts to decline in May 2020 after shooting up in April.

The headline unemployment rate declined to 13.3% from 14.7% in April. Rates for both months are a dramatic increase from the 3.5% rate in February.

The only way I can square this data with the massive volume of new unemployment claims is that a lot of people are getting new jobs after being furloughed. That is the only way the U3 is not above 20%.

So, my tentative guess is the economy is actually starting to recover, in spite of efforts of multiple governors to keep the economy in their states shut down.

Misclassification error in data understates unemployment

A new phenomenon in the age of shutdown is arising from the way the data is accumulated. The unemployment rate is determined by a large survey.

Turns out people are answering the question of their unemployment status as “employed but absent from work.” In normal times, that means a person is on vacation, thus actually employed.

In this shattered economy that means you got laid off or furloughed but are still getting paid by your employer or perhaps highly enhanced unemployment. People in that category are actually unemployed but are counted in the statistical data as employed.

(more…)

New unemployment claims since start of shutdown is about 1 out of 3 people who had a job in February.

Image courtesy of Adobe Stock.

I’ve run out of adjectives to describe the economic mess created by the shutdown.

New unemployment claims for week ending 6/13/20 were 1.508 million, seasonally adjusted, down from revised 1.566 million the previous week.

My tally of data:

  • 45.69 M – seasonally adjusted new claims since the economy was shut down – that is up 4.96 million in three weeks
  •   9.28 M  – new claims for unemployment by people who otherwise aren’t eligible for unemployment – self-employed and independent contractors
  • 54.97 M – total of seasonally adjusted plus independent contractors and self-employed people

Number of new claims for unemployment as percent of February civilian labor force:

(more…)

U-3 and U-6 Unemployment rate.

For a number of years I have been tracking the monthly unemployment data. That information is shown in the graph above. Included is monthly information back to April 2010. Prior to that I only picked up a few data points.

This graph shows the hit from the Great Recession and the painfully slow recovery which followed.

This discussion will be posted on several of my blogs.

Six different ways to measure unemployment

There are actually six different ways to calculated labor underutilization, all provided by the US Bureau of Labor Statistics. The economic devastation caused by the shutdown of the US economy means we need to start looking at these different indicators.

The above graph shows what is referred to as the U-3 and U-6 rates.

“What in the world are you talking about,” I hear you ask.

(more…)

Unemployment rate rises to 14.7% in April.

Unemployment Rate by EpicTop10.com is licensed under CC BY 2.0

Shutting down the economy has predictable, expected consequences. One that became visible on Friday was 20 million jobs vaporizing in the last month which resulted in an expected soaring unemployment rate.

A ban on everything other than immediate emergency medical care has cratered revenue of hospitals bringing layoffs to the entire industry.

Finally, making unemployment benefits higher than the earning capacity of a large portion of people has the fully expected consequence of making people hesitant to return to work.

This discussion will be posted across several of my blogs.

5/8/20 – Wall Street Journal – April Unemployment Rate Rose to a Record 14.7% – Thirty-three million people filing a first-time claim for unemployment drove the unemployment rate to 14.7%. Oh, lots of those new claims were filed after the cutoff for the April calculations.

A staggering 20.5 million jobs disappeared. Article points out the number of jobs destroyed are equal to all the job gains over the last decade.

Picture it this way – that is the equivalent of everybody who found a job over the last decade getting laid off.

(more…)