New claims for unemployment again drop slightly for week of 10/3/20 (corrected from 10/8).

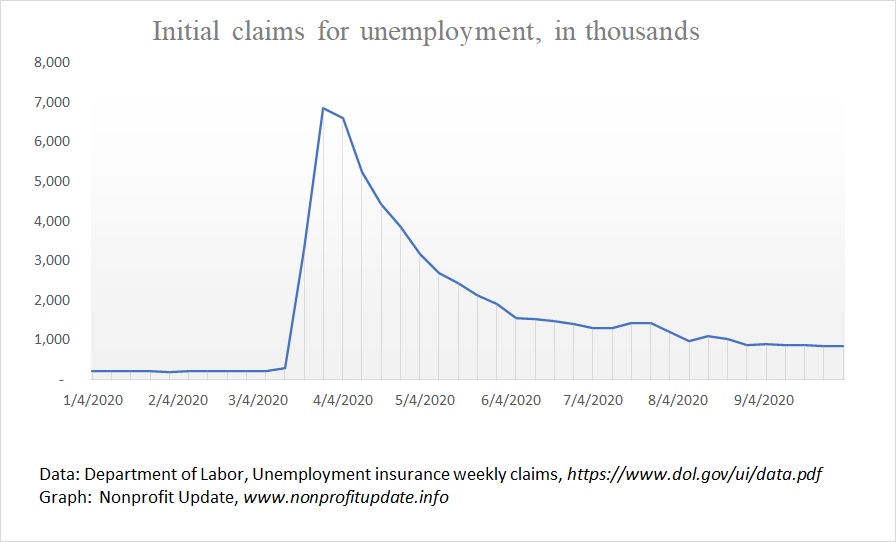
The number of new claims for unemployment for week ending 10/3/20 continues to decline a bit. Since 8/29/20 the new claims have been in the mid- to high 800 thousands. Change in the last five weeks, starting with 9/5/20 are +9K, -27K, +7K, -24K, -9K.

To again put this in context, before the government induced shutdown of the economy new claims averaged about 220K per week.

The number of continuing claims for unemployment is continuing to drop. I’m not sure why this is. Part is due to people going back to work.

(more…)

Why I talk about economic indicators so often.

 
Image courtesy of Adobe Stock.

One of the frustrations I have experienced as an auditor is the statistical information made visible by the AICPA and publications from others is that the economic data mentioned routinely lags behind two or three quarters on the date it is published.  Another trade association reports giving trends in the religious communities, but the survey information is provided late in the year for the prior calendar year.

The result is when I’m working on an audit or review several months later, the readily available economic data is from the start of the fiscal year I’m analyzing. Sometimes the data is for the prior fiscal year I’m considering. That doesn’t do me much good.

Long time ago I came across a comment that CPAs ought to start tracking key economic indicators on their own.

What a great idea!

(more…)

Did the lockdowns have any beneficial impact on the rate of new infections?

Enough time has passed that there is enough information to start analyzing the lockdowns. Preliminary info is not pretty. Image courtesy of Adobe Stock.

Indications are starting to emerge that the answer to the question may actually be no.

Previously mentioned one analysis which found a weak statistical correlation between weaker lockdown requirements and lower infection rate. The study found no correlation between the date that states started releasing the lockdown restrictions and subsequent infection rates.


The rate of infections accelerates rapidly and then hits an inflection point where the rate of infections either plateaus or the rate slows dramatically.

The following study suggests the lockdowns have no correlation to when the infection rates hit that transition point. In fact, the inflection point normally is reached before the lockdowns could have had any impact.

10/4/20 – National Review – Stats Hold a Surprise: Lockdowns May Have Had Little Effect on Covid-19 Spread

(more…)

Headline unemployment rate drops another half percent in September 2020.

The unemployment rate dropped from 8.4% in August 2020 to 7.9% in September.

Amongst the extremes we are seeing during the shutdown, that 0.5% drop is the smallest monthly decline since the peak in April.

(Cross post from my other blog, Attestation Update.)

Check out the extreme swings in the U-3 unemployment rate over the last 7 months:

(more…)

Economic bad news keeps rolling in, but hint of good news is on the horizon.

Parked airplanes idled by pandemic shutdown. Image courtesy of Adobe Stock.

The bad news on the economy called for the shutdown just keeps growing but there is a hint of good news in the near future.

First the good news.

9/30/20 – CNBC – US economy plunges 31.4% in the second quarter but a big rebound is expected – Commerce Department calculations of Gross Domestic Product (GDP) for the second quarter were revised, which is routine, dropping from an annualized contraction of 31.7% down just a little to 31.4% reduction in GDP.

(more…)

Minimal drop in number of new unemployment claims for last four weeks as of 9/26/20; more people going back to work.

Image courtesy of Adobe Stock.

The number of new claims for unemployment for week ending 9/26/20 has been about the same over the last five weeks, in the mid- to high 800 thousands. Last big drop was the week of 8/29/20. To again put this in context, before the government induced shutdown of the economy new claims averaged about 220,000 per week.

Good  news is the number of continuing claims for unemployment is continuing to drop, which means that more people are going back to work than loosing their job.

The devastating impact of the economic shutdown continues to be painfully obvious.

New Graphs

Starting this week that way the information is presented for this ongoing analysis will be in graphs.

(more…)

Observations from San Diego on economic destruction from shutdown.

View directly underneath Coronado Bridge shows the arches in the support towers. Photo by James Ulvog.

It is sad to personally observe the economic devastation from the shutdown.

We spent a few days in San Diego last week. Stayed at a hotel downtown near the harbor. Saw several things showing the severity of the economic damage.

Air travel

For quite a long time airplanes have not been allowed to leave San Diego International Airport until 6:30. It is funny to hear the first engine rev up a few seconds after 6:30 a.m.

I have noticed on previous vacations that there is a string of airplanes lined up ready to leave right at the stroke at 6:30. The planes take off approximately 1 minute apart.

(more…)

Stats on infection coronavirus rates not showing what you would expect. Time to open the economy.

Image courtesy of Adobe Stock.

We have been locked down long enough for the volume of statistics to build up to the point of allowing deeper analysis. As is always the case, the statistics can also be manipulated to give whatever answer you want. Deeper, honest analysis is starting to show surprising results, for example, the lack of correlation between infection rates and lockdown policies.

Surprising results on the low correlation will be mentioned after some game playing is described.

Wall Street Journal – /9/9/20 – The Sturgis Statistical Misfire – For this story remember the old saying

  • Figures don’t lie, but liars figure

The annual motorcycle rally in Sturgis, South Dakota routinely draws huge numbers of people to the town, whose population is only 7,000 people. Attendance at the 10-day event this year was lower than usual with an estimated 460,000 motorcycle enthusiasts hanging around.

Frightening news reports at the time said this would cause massive numbers of Covid infections leading to massive numbers of deaths.

(more…)

The shutdown is killing people. Some estimates of ‘excess deaths’ from the lockdown.

Image courtesy of Adobe Stock.

The comment that shutting down the economy represents a trade-off of lives versus jobs is an invalid comparison.

The real trade-off from a shutdown is lives versus lives.

People are dying because of the shutdown. The shutdown is killing people.

It is time to open the economy.

I don’t have time to summarize all the articles I have read making this point. Here are just three examples.

The pandemic is killing dementia patients

Washington Post – 9/16/20 – Pandemic isolation has killed thousands of Alzheimer’s patients while families watch from afar – The Washington Post, the Post, studied data from CDC to identify there have been 13,200 excess deaths from Alzheimer’s and dementia since the shutdown started. Excess deaths are the extra deaths over the number that would otherwise be expected because of some particular situation.

(more…)

Slight improvement in new unemployment claims for week ending 9/12/20.

Image courtesy of Adobe Stock.

The number of new claims for unemployment for week ending 9/12/20 dropped a little, with “only” 860,000 people losing their jobs, down from an upwardly revised 893,000 the previous week. For contrast, before the government induced shutdown of the economy new claims averaged about 220,000 per week.

Better news in the data is the number of continuing claims for unemployment dropped about twice as much as the new claims, to 12.6M for the week ending 9/5/20.  That is the lowest since the shutdown started.

CNBC report on 9/17/20 says Jobless claims were lower than expected but unemployment growth is still sluggish. The number of new claims was slightly better than  the 875,000 which economists expected.

As I continue to sort out for myself what this means, will continue listing the stats I’m tracking.

The number of new claims for unemployment and number drawing unemployment is provided by Department of Labor. I calculated the net change, which I assume represents the number of new jobs, although it could also be that people dropping out of the job market wash into the new jobs number:

(more…)

New claims for unemployment slowly declining with new jobs exceeding new claims; 9/5/20

Image courtesy of Adobe Stock.

For the third time since start of the recession, the number of new claims for unemployment for the week ending 9/5/20 was below the 1,000,000 mark. For contrast, before the government induced shutdown of the economy, new claims averaged about 220,000 per week.

On the other hand, the number of new claims was flat for the week – the damage from the shutdown in terms of new claims did not go down.

As I continue to sort out for myself what this means, will keep listing the stats I’m tracking.

The number of new claims for unemployment and number drawing unemployment is provided by Department of Labor. I calculated the net change, which I assume represents the number of new jobs, although could also be that people dropping out of the job market could wash into that number:

(more…)

Unemployment rate declines again in August 2020 after sharp spike in April 2020.

After shooting from 3.4% in February to 14.7% in April, the headline unemployment rate has dropped to 8.4% in August.

You will interpret the statistics as you wish.

Looks to me like people are slowing getting back to work after the shock of the pandemic and follow-on government-ordered shutdown of the economy.

There are six different measures of unemployment, each providing a slightly different perspective. Put them all together for a more complex picture the economy.

At the top is a graph since 2007 of U-3, the headline statistic, along with U-6, the broadest stat which includes discouraged workers, marginally attached, and those working part time because they can’t find full time work.

For a closer picture, focus in on the stats since January 2019:

(more…)

Devastation from government ordered shutdown of the economy – 1 of 3

What the California economy might look like by the time it is allowed to reopen. Photo of abandoned farm in North Dakota by James Ulvog.

Over the last several weeks I have accumulated a number of articles describing the economic and health damage caused by the government ordered shutdown of the economy.

I’ve been wanting to post these for a while. In light of the California government imposing more severe constraints on when the economy will be allowed to start functioning again, it is now time to publish.

Economic damage

7/30/20 – Wall Street Journal – US Economy Contracted at Record Rate last Quarter; Jobless Claims Rise to 1.43 million – The preliminary estimate of the collapse in the US economy for the second quarter came in at an annualized 32.9% drop. Again, that is annualized. In addition, it will be revised in each of the next two months as additional data is gathered by the feds.

That follows an annualized drop of 5% in the first quarter.

8/25/20 – CNBC – American Airlines to cut 19,000 jobs when federal aid expires in October(more…)

Number of new unemployment claims rises for week of 8/15/20, but new jobs continue to exceed new losses.

Unemployed business people. Image courtesy of Adobe Stock.

For the first time since 4/4/20, the number of new claims for unemployment increased for the 8/15/20 reporting date. Oddly, the increase of 109K is small for the time of pandemic but would be equal to about 4 weeks of new claims before the pandemic hit.

As I continue to sort out what this means, I’ll continue giving the same stats as provided for recent weeks.

Since the middle of June, which is when I started tracking this metric, the number of new jobs has exceeded the newly lost jobs by 5 million.

Looks to me like these stats suggest the economy is recovery, but at a slow pace, with unprecedented numbers of people still out of work at the same time as an extremely high number of new claims for unemployment are still rolling in.


The number of people drawing unemployment the number of new claims, and the resulting number of new jobs:

(more…)

New claims for unemployment increase for week of 7/18/20.

Image courtesy of Adobe Stock.

For the first time since 4/4/20, the number of new claims for unemployment increased for the week. Oddly, the increase of 109K is small for the time of pandemic, it would be equal to about 4 weeks of new claims before the pandemic hit.

As I continue to sort out what this means, I’ll continue giving the same stats as provided for recent weeks.

The number of people drawing unemployment the number of new claims, and the resulting number of new jobs:

(more…)