Same-Meal-at-the-Same-Restaurant price index. I don’t even want to calculate the increase for this meal.

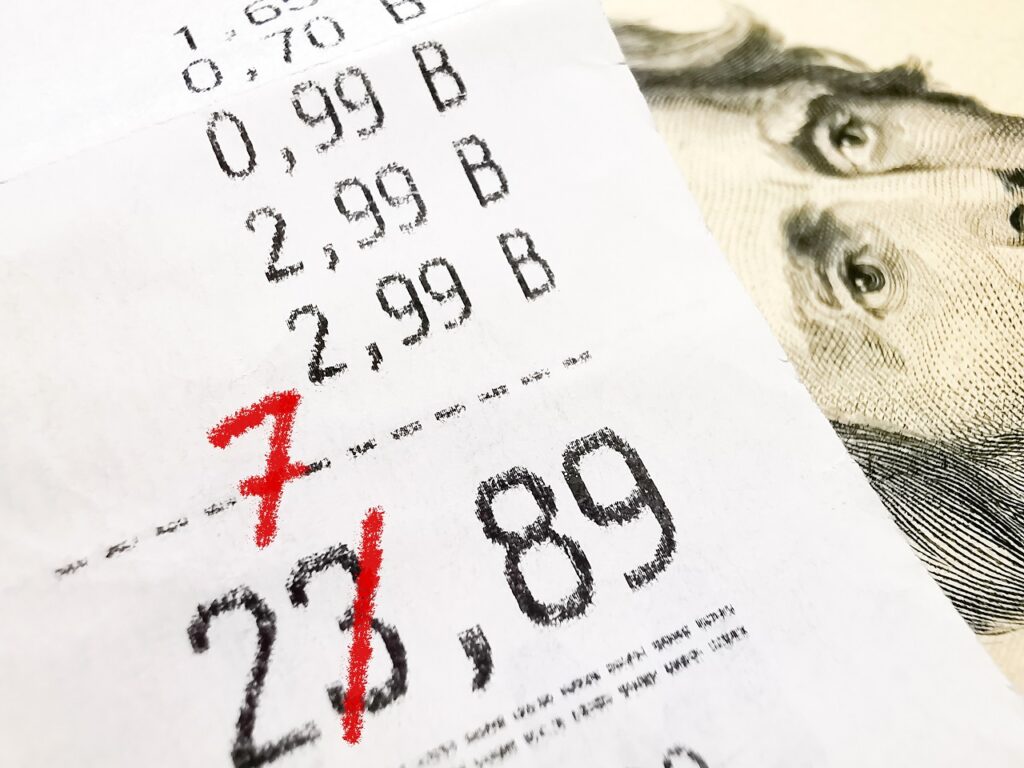
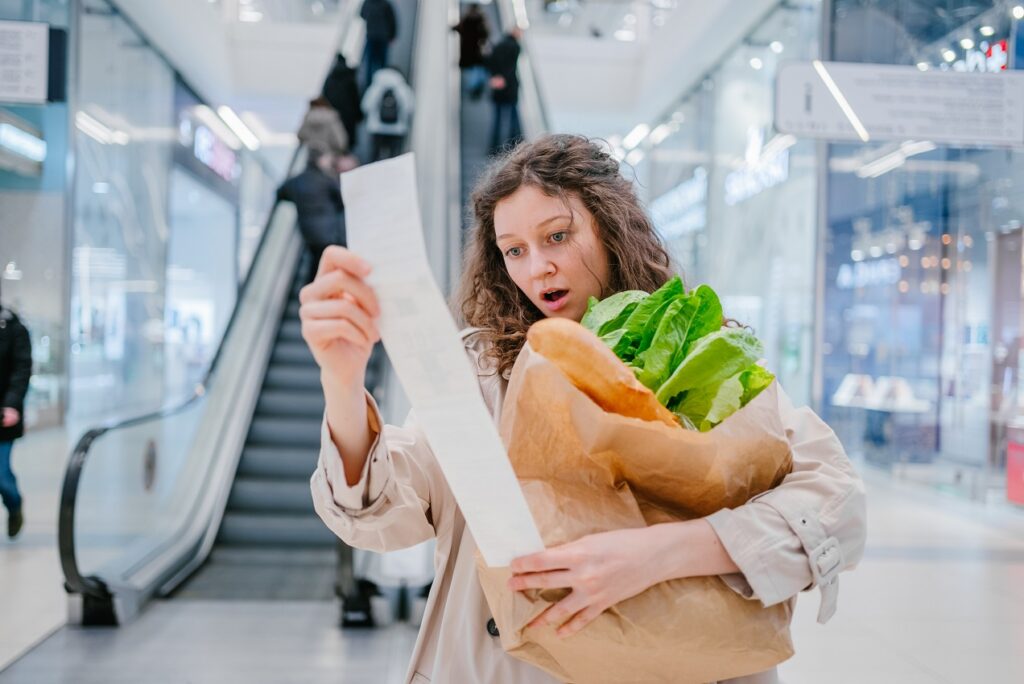
My reaction every time I see the total on the grocery store cash register.
Image courtesy of Adobe Stock.

Before leaving California I provided several illustrations of the actual price increases at a specific restaurant for the identical meal. Since moving to Williston, North Dakota I don’t have a lot of good data points yet. We’re still going to different restaurants and ordering different items so I don’t have a useful point-to-point comparison.

Yesterday my son gave me a painful example.

Last March he ordered one foot-long sub sandwich, a 6 inch sandwich, and one soda.

The price?

$13.26.

Yesterday he ordered the exact same items from the same restaurant.

The price?

(more…)
15% increase in 8 months. Another entry for the Same-Meal-at-the-Same-Restaurant price index.

Image courtesy of Adobe Stock.

The size of a bite which inflation is taking out of every meal is accelerating for those of us who are not living at the top of an ivory tower fortress inside the D.C. Beltway.

Got lunch from Jimmy John’s yesterday. They fix up yummy sandwiches. 

I had turkey on French bread with provolone cheese. Split a large sandwich with my dining partner.  ‘Twas delish’.

Price was $14.99.  Yeah fifteen bucks for just the sandwich, to go, so nothing for the greedy state tax machine.

Last August the exact same sandwich was $12.99. Up an even $2.00.

(more…)

Same-Meal-at-the-Same-Restaurant price index increases 12% in 5 months. Oh, and a less tasty meal.

Image courtesy of Adobe Stock.

For another data point of inflation experienced by consumers, let’s consider the holiday meal at a restaurant here in Rancho Cucamonga.  Consider the contrast with the official CPI measurements.

This is third discussion on the same-meal-at-the-same-restaurant price index.

One of the nicer restaurants (perhaps nicer is only on my scale) in our area is called Mimi’s. They offer a limited selection of meals on holidays which are nicer than their usual entrée. Today two of the five main choices were either ham or turkey with identical side dishes of mashed potatoes, cornbread dressing, green beans, choice of three appetizers, and choice of three desserts.

On Thanksgiving Day 2021 the meal cost was $25. On Easter day 2022 the meal cost was $28.

That is a $3 increase.

(more…)

The Fried-Chicken-Meal index continues to show severe inflation.

Image courtesy of Adobe Stock.

Introducing the fried-chicken-meal inflation index. 

Previous discussions on this blog have featured the consumer price index measuring prices paid by urban consumers, the producer price index measuring input prices paid by manufacturers and producers, along with the personal consumption expenditure index, which is the favorite measure of inflation at the Federal Reserve Bank.

Now we have the fried-chicken-index.

This newest inflation measure is based on the price charged in Rancho Cucamonga, California (including tax) for a three-piece chicken tenders meal with one side, biscuit, and medium soda as prepared by the Colonel from Kentucky.

According to this index, the price of the meal went up 4.7% in the first quarter of 2022.

(more…)

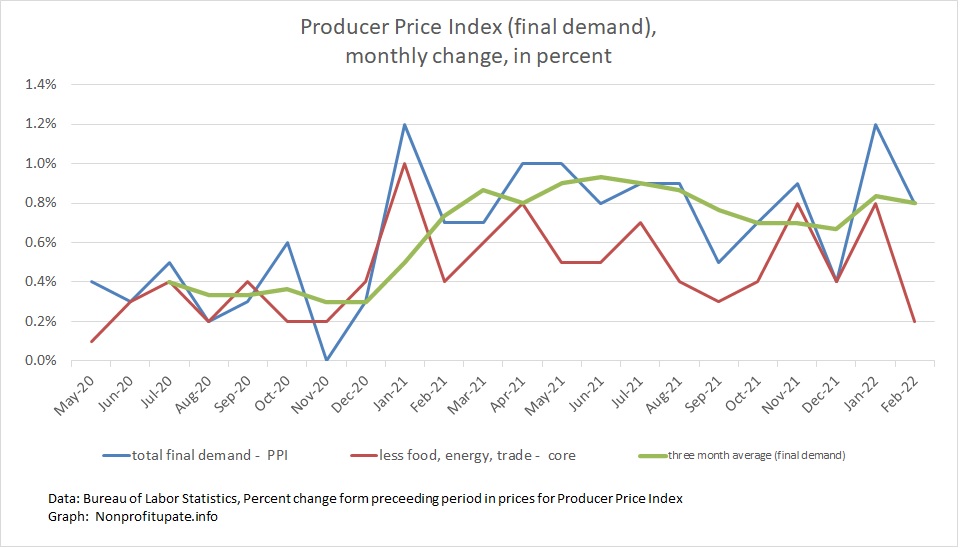
Producer Price Index up 0.8% in February 2022 with January revised upward from 1.0% to 1.2%.

The Producer Price Index (PPI) rose 0.8% in February.   The previously reported 1.0% rise in January was revised to 1.2%. So that is actually a cumulative increase of 1.0% in February

Keep in mind the prior monthly increases PPI are revised as needed. This is in contrast to CPI which is not revised.

In February, core PPI, without food, energy, & trade, was up 0.2% in February with January revised downward from 0.9% to 0.8%.

For background, the Bureau of Labor Statistics provides a description of PPI:

“The Producer Price Index (PPI) is a family of indexes that measures the average change over time in selling prices received by domestic producers of goods and services. PPIs measure price change from the perspective of the seller. This contrasts with other measures, such as the Consumer Price Index (CPI), that measure price change from the purchaser’s perspective. Sellers’ and purchasers’ prices may differ due to government subsidies, sales and excise taxes, and distribution costs.”

So the PPI measures prices received by producers for their goods and services. Those costs roll into the goods and services you and I buy as end consumers.

This means the increases in wholesale prices, which show a lot of inflation, are heading our way as those increases work themselves into the CPI.

Graph at the top of this post shows the monthly price change for total demand with separate line for total demand goods and total demand services.

With revisions, the year over year increase in PPI is 10.0% in February and January, which is only a slight increase from 9.9% in December and November and the increases were just under 9.0% for October back to August.

Take a look at the year over year change in final demand and core change which means without food, energy, and trade.

(more…)

High inflation rates likely to continue for remainder of 2022.

Image courtesy of Adobe Stock.

It is looking like we are going to see high inflation numbers for a while, probably least all of 2022.

Mentioned yesterday the CPI increase of 7.9% in a year hit a 40 year record.

Treasure Secretary’s expectations.

In an interview on 3/10/22, Treasury Secretary Janet Yellen said the inflation numbers are going to be uncomfortable for the rest of 2022.

Fox Business is one source that covered her comments on 3/10/22: Treasury Sec. Yellen contradicts Psaki: Likely to see another year of ‘very uncomfortable’ inflation.

The money quote:

(more…)

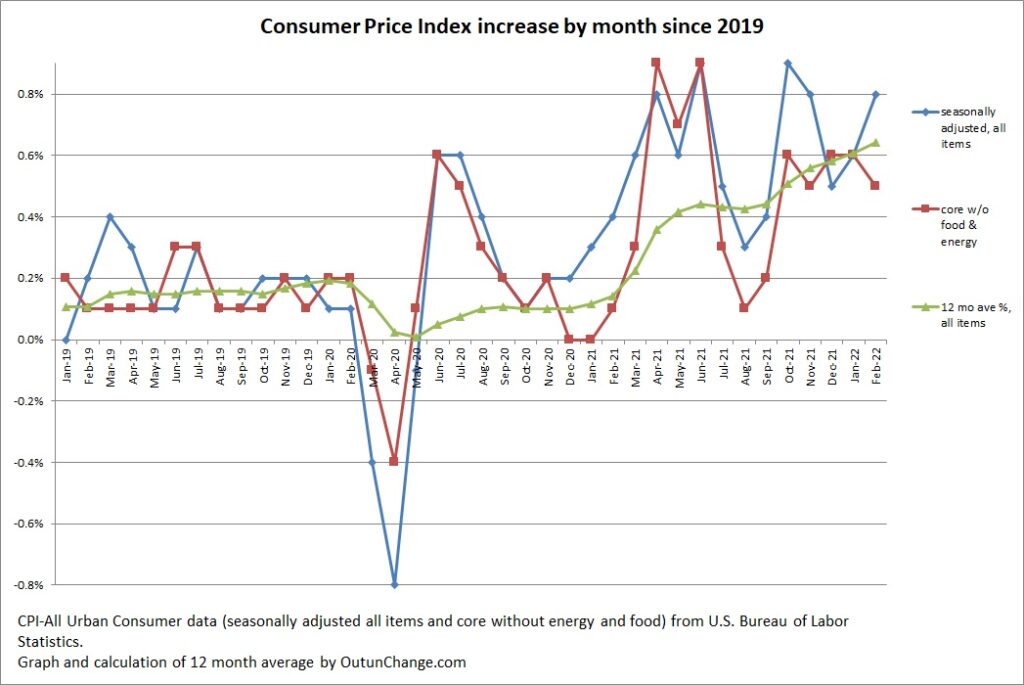
Consumer Price Index increases 0.8% in February 2022. One year increase highest since January 1982.

The Consumer Price Index (CPI) increased 0.8% in February 2022 after increasing 0.6% in January, 0.5% in December 2021, and 0.8% in November.

That is 1.9 % for the last three months.

Graph at top of this post shows the monthly increase in the all-items index along with the core change, which excludes food and energy. Graph also shows an average of the preceding 12 months for the all-items indicator.

The 12 month cumulative change continues to skyrocket. The monthly change in all items index and the cumulative change for 12 months looks as follows:

(more…)

In spite of what you see with your own eyes, the Department of Agriculture says food inflation in 2021 was the same as 2020. Don’t hurt yourself laughing.

Yeah, the research wizards at the Ag Department concluded food inflation in 2021 was exact same as 2020. We will see even smaller price increases in 2022.

US Department of Agriculture – 1/28/22 – 2021 retail food price inflation continued at the same pace as 2020, but varied among food categories – In a clever disinformation effort, the alleged economists at the Economic Research Service of the U.S. Department of Agriculture claim food prices increase of 3.5% during 2021 was the same rate of increase as in 2020. The mere 3.5% during 2021 is only slightly higher than the historical average of 2% from 2000 through 2019.

In newsflash to everyone who actually buys groceries or goes to a restaurant, food prices barely increased in 2021.

Because of the pushback this article is already receiving, it will likely be memory-holed momentarily so I will quote a few parts of the article. Will quote the entire article at the end of this post.

The headline information:

“Retail food prices increased by 3.5 percent in 2021, equal to the rate in 2020 and greater than the historical annual average of 2.0 percent from 2000 to 2019. Of the 12 food categories depicted in the chart, six showed slower price increases in 2021 compared with 2020.”

Prices for half the food you buy are coming down. Cool, huh?

(more…)

Record high inflation is going to continue and likely get worse.

Image courtesy of Adobe Stock.

There are a lot of indications the inflation rates we’ve seen in the last year or so are going to continue. My guess is we will see higher inflation in the next year than we did in 2021. Author of the article discussing PPP says he expects a shock in the CPI sometime in the next few months.

Merely a few recent items pointing towards sustained and even increasing inflation:

  • Dollar Tree is now $1.25 Tree.
  • Experienced farmer describes how severely inflation is hitting his operations. Those increases are going to appear on the store shelves soon.
  • Producer Price Index is accelerating. Indications that unprocessed and intermediate goods are going up far faster than what we’re seeing at retail, so expect accelerating inflation.
  • Unusually high lumber prices are back.
  • Decent prices on cars will be harder and harder to find.

Dollar Tree is now Dollar and a Quarter Tree – Bought a couple items at Dollar Tree. They all rang up at $1.25. Glanced around the store noticing all the signs said $1.25.I asked the clerk about it and he said everything in the store is now a dollar and a quarter.

(more…)

More indications the supply chain crisis will not be going away anytime soon.

Illustration of supply chain. Image courtesy of Adobe Stock.

There are lots of reports out with tidbits of information which combine to paint a picture that the tangled supply chain is not going to untangle anytime soon. For your consideration:

  • New system to allow cargo ships to register a scheduled arrival time will make it look like the number of ships waiting to unload has decreased.
  • Big increase in the number of people who started their own business since start of the pandemic, becoming self-employed.
  • Your favorite restaurant may stop taking delivery orders during crunch time.
  • Pay and working conditions for truckers are horrible – no wonder there aren’t enough of them.

FreightWaves – 12/1/21 – Ships in California logjam now stuck off Mexico, Taiwan and Japan – You may have heard the number of ships parked off the coast of ports in Southern California has dropped recently.

Good news, right?

Well, not so fast.

(more…)

What the government induced disruption of the employment market looks like from a consumer’s perspective – #2.

This sign is becoming more common during business hours. Image courtesy of Adobe Stock.

My wife and I are seeing firsthand the impact of turmoil in the employment market to include restaurants that have to close for the day because no staff showed up to work. One restaurant is making up stories about masks being government-required.

Previous post on this topic was back on 6/4/21:  What does the economy wide staffing shortage look like to a customer?

This discussion will highlight disruptions I have seen in our local community in the last month. We will discuss separately the wide range of government actions which have caused this turmoil.

In the meantime…

Daily Bulletin – 11/25/21 – “Sorry!” Customers with prepaid Thanksgiving meal orders find doors shut at Boston Market in Rancho Cucamonga – The only employee showing up at the Boston Market stored in my hometown put a note on the door saying

“No employee showing up today… We are unable to fulfill the orders! We are sorry!”

(more…)

Supply chain disruptions not getting better anytime soon.

Cargo container on chassis pulled by big rig truck. Image courtesy of Adobe Stock.

String of articles are pointing at disruptions in the supply chain continuing well into 2022 or possibly 2023.

A few of said articles discussed below:

  • Tally of ships off the Long Beach and Los Angeles ports rises to record of 111.
  • Experienced truck driver describes how every step of the trucking part of the supply chain is tangled up, from extra wait getting into the port all the way to several hours waiting to drop cargo at warehouses.
  • Disruption of chip supply expected to last until sometime in 2023.

Do please keep in mind this is due to the hubris of government officials thinking an economy can be turned off and on light a light switch and also flooding the economy with several trillion dollars without any corresponding increase in output.

Washington Free Beacon – 11/10/21 – Record Number of Ships Stranded Outside California Ports – Article sites Business Insider as saying there are 111 ships waiting to unload at Los Angeles and Long Beach ports as of 11/9/21. This backlog is new high from previous record of 108 ships on 10/21/21.

(more…)

More reports on the devastation caused by the social and economic shutdown.

Illustration of what happened to average earnings of working poor because of the economic lockdowns. Image courtesy of Adobe Stock.

Reports keep rolling in on the destruction caused by governmental orders to shut down the economy, our educational system, and large portions of society.

My prediction is we will continue to these reports for the next five or 10 years,

Merely two of recent articles:

  • Excess deaths are identifiable for people who had mental health struggles.
  • Harvard study shows lockdowns seriously hurt earnings of poor folk while rich folk were earning more money.

Lockdowns killed people with mental health struggles.

Medical Express – 10/8/21 – Excess deaths in people with mental health conditions increased during the Covid-19 pandemic– The lockdowns and other actions taken during the pandemic killed a significant number of people with mental health trouble.

Let me say it again – The shutdowns killed people who were already struggling with mental health problems.

A concept we all need to learn about is something called “excess deaths.”

(more…)

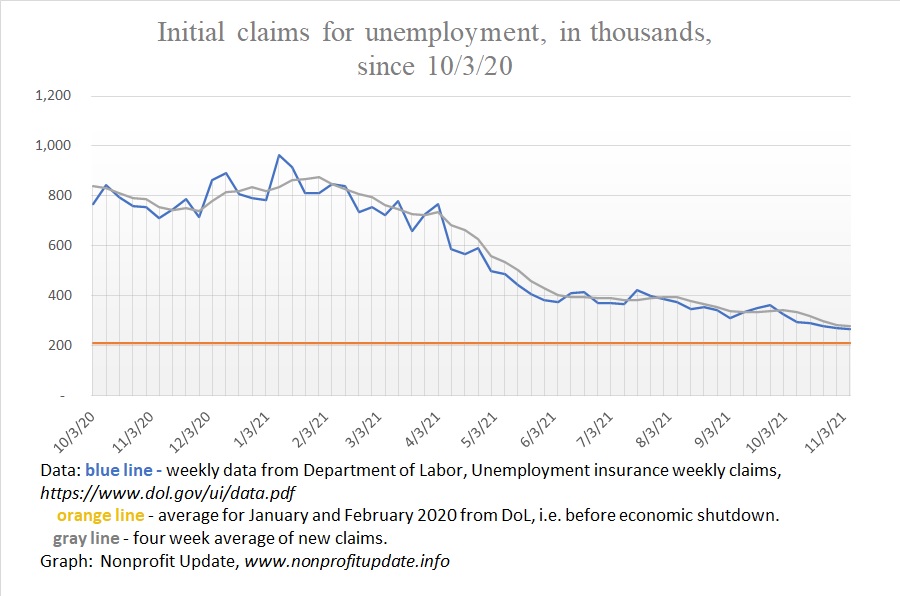
Number of people drawing unemployment continues to improve, but very slowly, as of the start of November 2021.

The number of new claims for unemployment is slowly declining.

For the week ending 11/6/21 there were 267,000 new claims. While this is encouraging progress, keep in mind the number of people who are getting laid off is still far above the average of 212,000 per week all the way back in January and February 2020. We are still seeing more people laid off every week than before the pandemic began.

Here is a recap of newly unemployed over the last several months:

(more…)