Consumer Price Index increases 0.9% in October for the second time in 2021.

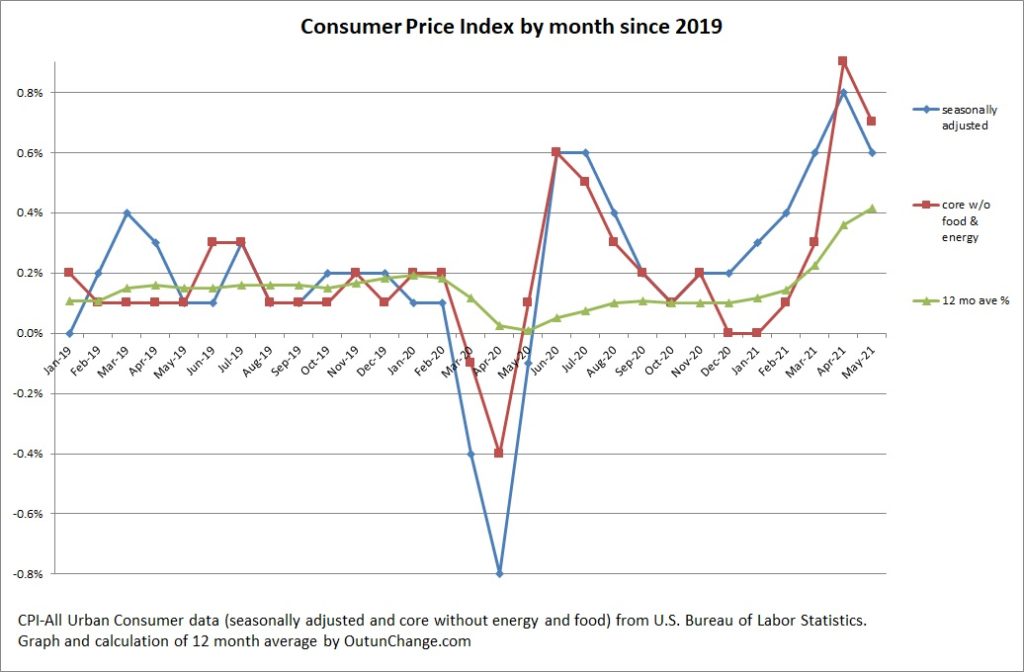
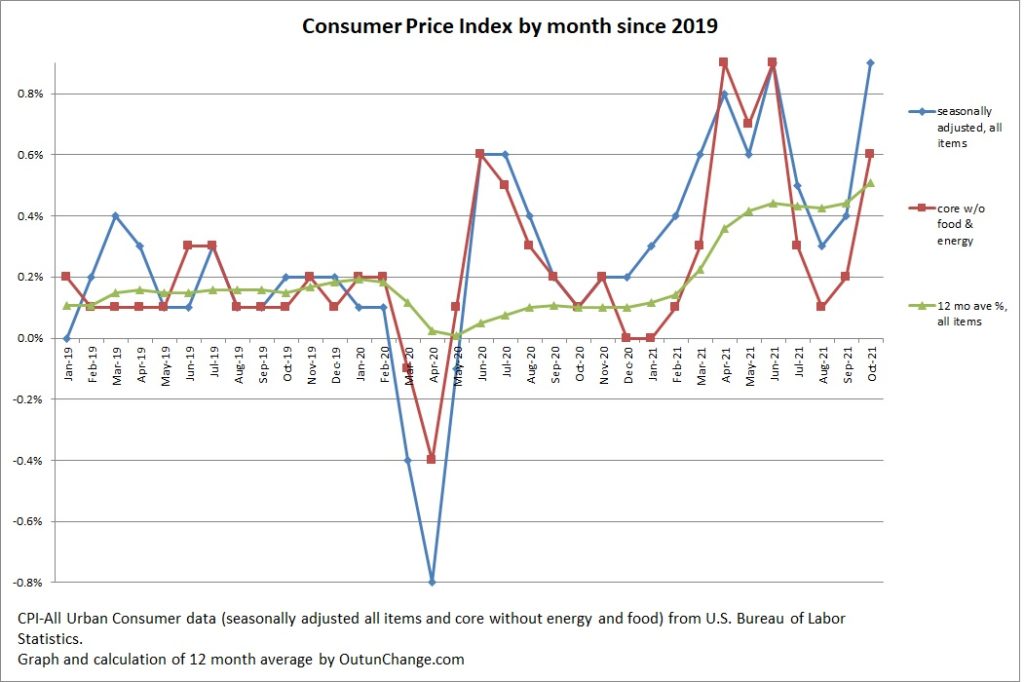
The Consumer Price Index (CPI) increased 0.9% in October 2021 after a more modest 0.4% increase in September and 0.2% in August.

The October increase matches the June increase of 0.9% and is slightly higher than April increase of 0.8%.

Diving into the components of the CPI shows the increases are broader than several months ago.

The press release from the Bureau of Labor Statistics explains:

“The monthly all items seasonally adjusted increase was broad-based, with increases in the indexes for energy, shelter, food, used cars and trucks, and new vehicles among the larger contributors. The energy index rose 4.8 percent over the month, as the gasoline index increased 6.1 percent and the other major energy component indexes also rose. The food index increased 0.9 percent as the index for food at home rose 1.0 percent. “

Warning sign as we roll into winter is fuel oil increased 12.3% in October and utility gas increased 6.6%. Keep in mind those are changes for the month, not for the year.

(more…)

Just how much money has the Federal Reserve created out of thin air and injected into the economy?

Got to wondering how much money the Fed has created out of thin air and then pumped into the economy.  The answer is a vague “bunches and bunches.”

How do I know that? Because of my reading over the last few years. I pay attention to such stories (yeah, yeah, I know – I’m weird – pray for me as you feel led). I also am aware the Fed pumped a lot of money into the economy when the pandemic started.

There have been lots of news reports commenting they have been pumping something in the range of $100 billion a month into the economy after their initial round.

As I was thinking about things the federal, state, and local government have been doing to harm the economy, got to wondering just exactly how much fiat money the Fed has been creating, out of thin air of course. Yeah, I wonder about such things.

Answer is again bunches and bunches, and is measured in trillions of dollars.

Graph above shows the amount of total assets on the Federal Reserves balance sheet since around 2003.

Wow.

(more…)

About that new vaccination mandate for the private sector…

Image courtesy of Adobe Stock.

The promised vaccine mandate for private companies with 100 or more employees were published on 11/4/21.

The federal diktat applies to private-sector employers with 100 or more employees. Companies have to verify employees have been fully vaccinated or require a weekly negative test. In addition anyone not vaccinated will have to wear a mask at work.

The vaccinate-or-test requirement goes into effect 1/4/22, two months from now.

Oh yeah, that mask requirement for the unvaccinated goes into effect 12/5/21, a month from now.

Separate federal diktats applied to federal employees, any company with a federal contract (think airlines, trucking companies, defense contractors), and any health facility with billings to either Medicare or Medicaid program.

Newest rules catch another 84 million people the mandatory vaccinate-or-else requirement.

News flash:  The Fifth Circuit Court of Appeals issued a temporary injunction against the rules on 11/6/21.This circuit covers Texas, Louisiana, Mississippi, South Carolina, and Utah. The ruling cited “grave statutory and constitutional issues.”  Brief coverage from Investing on 11/6/21:  U.S. federal appeals court freezes Biden’s vaccine rule for companies.

Background on the rules and then the beginning points of issues with the requirements.

Wall Street Journal – 11/5/21 – OSHA Covid-19 Vaccine Mandate: What to Know

(more…)

Deliberate policies which compound supply chain issues.

Image courtesy of Adobe Stock.

This is start of what will be a series of posts describing steps taken by federal, state, and local officials to compound the supply chain problem we are experiencing. Other policies, deliberately imposed, have the foreseeable consequence of being a drag on the economy. There are lots of recent articles pointing out policies, intentional policies by supposedly intelligent bureaucrats, which have the effect of making it more difficult to get things done.

A few policies that come to mind:

  • Tax on every container not pulled by a zero-emission truck.
  • Only a fraction of the trucks in the country allowed to pick up a container in California.
  • Owner/operators not allowed at the ports.
  • Fines on shipping companies who can’t get their containers out of the port because of congestion in the supply chain.

Additional tax on non-zero-emission trucks picking up cargo

Port Technology – 11/5/21 – Port of Los Angeles accelerates zero-emissions truck efforts – The Los Angeles Board of Harbor Commissions approved a requirement for trucks picking up cargo at either Long Beach or Los Angeles ports to be zero emission starting 4/1/22. Or else.

(more…)

Labor shortage about to get worse for hospitals, police and fire departments. Also any company with over 100 employees.

Image courtesy of Adobe Stock.

As you read the following articles, keep in mind the LA County Sheriff and the Riverside County Sheriff have both said they will not enforce any vaccination mandate for their staff. In addition, the Chicago police union is in court trying to get and order to prohibit the vaccination dictat.  Officers who are not in full compliance have been pulled off patrol.

Imminent problems:

  • There are widespread firings on near-term horizon for police officers, firefighters, and hospital workers.
  • 90% of companies with over 100 employees expect to lose staff from their already understaffed organizations because of vaccination mandates.

Chronicles Magazine – 10/18/21 – The Impending Mass Firing of America’s Unvaccinated In the midst of an existing shortage of workers and a labor force participation rate that has come close to recovering from the government-imposed recession, there is soon to be another major problem hit the economy: the pending firing of large numbers of people who refuse to get vaccinated or for whom employers refuse to provide any exemptions.

The massive hit to employment is likely to hit police, firefighters, doctors, and nurses particularly hard. The resulting, fully expected consequence will be deterioration in public services.

(more…)

You cannot turn an economy off, then turn it back on. Here are the results when hubris makes you think you found the magic switch. Part 3.

Image courtesy of Adobe Stock.

The supply chain for so many of the things we buy is messed up at every step of the logistics system. Former CEO of Walmart pointed out the steps in the supply chain that are tangled up:

  • Loading ships at ports in Asia.
  • Ships are stuck in the water waiting to unload.
  • Unloading at ports in the US is another chokepoint.
  • There are not enough truck drivers.
  • Not enough labor and the various points in the distribution system inside the United States.
  • Shortage of people to put stuff on the shelves.

Essentially every stage of the distribution channel is tangled up. Biggest thing that could be done to get things moving normally would be more people to work at every step of the distribution system. Labor shortages, in other words.

This post discusses two articles:

  • California has imposed restrictions on trucking which has drastically reduced the number of trucks which can be operated in the state.
  • One article provides us a survey of a dozen other articles, each of which describes a different aspect of the supply chain disaster.

Part one of this series can be read here. Part two here.

The Last Refuge – 10/14/21 – The California Version of The Green New Deal and an October 16, 2020, EPA Settlement With Transportation is What’s Creating The Container Shipping Backlog – Working CA Ports 24/7 Will Not Help, Here’s Why Author spent three days researching reasons for the backlog of containers here in California. Checking resources, researching details, and other research showed some surprising things.

(more…)

What’s likely to happen with inflation? More of it and for extended time.

Rising costs and constrained shipping capacity is driving inflation and disrupting supply chain across the economy. Image courtesy of Adobe Stock.

Indicators I can see suggest inflation is going to continue at a high rate for quite some time.

This is a bigger issue for charities that for businesses.

For charities, inflation will push up the expenses of performing ministry and providing help to those in need.

Simultaneously, it will put pressure on donors because the money they have left over after rent, groceries, and gasoline will be shrinking. That will put pressure on contributions. Charities cannot push through an increase in contributions like a business can push through increase in prices.

Here are a few of the articles I have read recently pointing towards ongoing rise in prices:

  • Rent component of CPI will increase substantially over the next year because of the way the index is calculated.
  • Shipping costs have already skyrocketed.
  • Multiple food producers are struggling with rapidly increasing costs.
  • Major food producer expects their costs go up 11% in the next year with prices they charge to go up by 4%.
  • The phrase “stagflation” is back in play. Oh joy, a possible (likely?) return to the Carter administration.

Asia Times – 8/27/21 – US rent hikes will explode consumer inflation in 2022 – Anecdotal information indicates rental prices are skyrocketing.

A friend of mine priced the apartment they are living in to help a relative who was moving into the area. Price for this exact unit is 50% more than when they signed their annual lease a number of months ago.

An acquaintance reports the price for renting a particular house went up while they were thinking about it for a day or so.

Two friends report landlords renting apartments expect six months rent in advance and some landlords renting houses are expecting a year in advance. A year.

Article mentioned above says the reports floating around in the media indicate rent hikes overall are around 10%. Yet the CPI shows only 2% increase in rent.

How can that be?

Fascinating detail of how the CPI is calculated explains the anomaly and also points towards dramatic increase in the rent component of CPI over the next year.

(more…)

You cannot turn an economy off, then turn it back on. Here are the results when hubris makes you think you found the magic switch. Part 1.

Random stock outages are still common. Image courtesy of Adobe Stock.

The supply chain in most industries is tangled up somehow somewhere.

The people in federal and state governments with the staggering level of hubris to think they can wave their hands and make the entire economy do their bidding are willfully causing disruption in your life and in my life.

(more…)

Expectations growing that we will see rising interest rates and sustained inflation.

Image courtesy of Adobe Stock.

It isn’t just the current numbers that are hinting that inflation is back. Changes in CPI and PCE are unsettling.

There is also a clear statement from the Fed they will nudge interest rates up earlier than they previous announced. Also indications from two big banks that we will see rising interest rates.

6/17/21 – Dailywire – Federal Reserve Delivers Bad News About Expectations For Inflation, Raising Interest Rates: Report – Previously the Federal Reserve indicated interest rates would not have to be increased until sometime in 2024.

(more…)

New claims for unemployment are flat and ongoing claims are slowly decreasing as of middle of June 2021.

New claims for unemployment are flat compared to three weeks ago. Ongoing claims for unemployment at the state and federal level are declining, slow though the decline may be.

Number of weekly new claims for unemployment was 406,000 three weeks ago and 412,000 the most recent week. The increase in the most recent week offset the decline in the previous two weeks.

Most recent data shows ongoing claims at the state level dropped from 3,602,000 three weeks ago to 3,518,000 in the most recent week, for a net decrease of 84,000. There was an increase two weeks ago, large drop last week, and essentially no change this week.

The number of new claims is still double the average from before the pandemic.

Purpose of these posts on economic statistics is to help all of us keep current on what is going on in the overall economy.

Revised number of weekly new claims in state programs over the last four months to show the trend:

  • 728K – 3/27/221
  • 590K – 4/24/21
  • 406K – 5/22/21
  • 412K – 6/12/21

Following graphs show the devastation from the economic shutdown.

New claims

New claims for unemployment by week since the start of 2020:

(more…)

Accelerating inflation rate continues in May 2021.

Changes in the Consumer Price Index have been making a splash in the news lately. Increases over the last three months have been unusually high.

The headline consumer price indicator increased 0.6% in May after 0.8% in April and 0.6% in March. That is a big run of inflation for three months.

The core measure, which excludes energy and food costs, has been on a roughly parallel track with 0.7 increase in May following a 0.9% in April and 0.3% in March.

Graph at the top of this page shows the change in the primary inflation indicator, and the core index along with a 12 month average of the monthly change.

You can see a large drop in prices during the pandemic followed by spikes over the next several months. Price changes returned to normal range in the September 2020 through February 2021 timeframe.

What is behind those numbers? Let’s check out the Wall Street Journal’s narrative:

(more…)

Monitoring inflation through the Personal Consumption Expenditure (PCE) price index.

Another way to keep track of inflation trends is by watching the price index for the Personal Consumption Expenditure.

Please journey along with me as I continue my education.

In the news yesterday was the April increase which showed a 3.1% year-over-year increase compared to an expectation of a 2.9% increase. For one article discussing the news, check out the following:

I have started to track this data, gathering information back to the start of 2020. The month by month change in the headline index and the core index (which excludes food and energy costs) can be seen in the graph at the top of this post.

Before look at the year-over-year change, we need to look at the nature of the index. There are two main indices used to monitor inflation. The first is the Consumer Price Index (CPI) which everyone knows about. The other is the Personal Consumption Expenditures (PCE).

What’s the difference? Great question.

(more…)

New claims for unemployment decreasing at end of May 2021. Ongoing claims are flat.

Since my last post on 4/30/20, a month ago, there has finally been visible progress in the number of people losing their job.

Since 4/24/21 the number of new claims for unemployment has dropped from 590,000 to 406,000 in the week ending 5/22/21. Graph above shows improvement. Average had been running around 800,000 from early October 2020 until late in February 2021.

The number of new claims is still double the average from before the pandemic. As recently as February it was four times, so that is progress. From quadruple for oh so many months to merely double is good. Not great for all those people losing their job now, but at overall level it is progress.

Purpose of these posts on economic statistics is to help all of us sort out what is going on in the overall economy.

Revised number of new claims in state programs over the last four months:

  • 754K – 2/27/21
  • 728K – 3/27/221
  • 590K – 4/24/21
  • 406K – 5/22/21

Following graphs show the ongoing human cost of the economic shutdown.

New claims

New claims for unemployment by week since the start of 2020:

(more…)

Unemployment rate up slightly in April 2021 after slow decline since November 2020.

The unemployment rate skyrocketed during the pandemic heating a frightening 14.7% in April 2020, a year ago. It declined substantially, hitting 6.9% in October 2020.

Since November, he sent to the corresponding to the election, the employment rate has been slowly declining, drifting down to 6.0% in March 2021.

In April 2021, then upon rate inched up to 6.1%. This is the first monthly increase since the peak in April 2020.

To help understand the data and underlying trends, let’s dive deeper into the numbers.

The U-3 and U-6 unemployment rates since the start of 2019 are visible in the graph at the top of this post.

General trend visible in that graph is unemployment rate has been flat at around 6% since the fall after having been at below 4% for over a year before the pandemic.

For a longer-term perspective, check out the U-3 and U-6 unemployment rates since before the Great Recession:

(more…)

Continued struggles in recovery of job market.

Lots of companies are looking for new staff but can’t find enough workers. Image courtesy of Adobe Stock.

Spending by consumers is growing while the number of new jobs is not as strong as expected and employers are having a hard time finding enough staff.

5/7/21 – Wall Street Journal – U.S. Employers Added 266,000 Jobs in April as Hiring Slowed – Expectation among economic forecasters was employers would add 1 million new jobs in April. Actual results were a mere 266,000.

This follows a downward revision to the March data.

Leisure and hospitality (that means entertainment, hotels, and motels) saw most of the growth in April. In more detail, there are 331K new jobs in those sectors which offset a net decline of 65K in all other sectors.

Article repeats the comment seen in many of other articles that employers are having a hard time attracting new staff.

(more…)