The Consumer Price Index (CPI) increased 0.9% in October 2021 after a more modest 0.4% increase in September and 0.2% in August.
The October increase matches the June increase of 0.9% and is slightly higher than April increase of 0.8%.
Diving into the components of the CPI shows the increases are broader than several months ago.
The press release from the Bureau of Labor Statistics explains:
“The monthly all items seasonally adjusted increase was broad-based, with increases in the indexes for energy, shelter, food, used cars and trucks, and new vehicles among the larger contributors. The energy index rose 4.8 percent over the month, as the gasoline index increased 6.1 percent and the other major energy component indexes also rose. The food index increased 0.9 percent as the index for food at home rose 1.0 percent. “
Warning sign as we roll into winter is fuel oil increased 12.3% in October and utility gas increased 6.6%. Keep in mind those are changes for the month, not for the year.
Twleve month change for fuel oil is increase of 59.1%. Utility gas service? Up 28.1% year-over-year.
Back to the all items index…
Grim news is the 12 month change is an increase of 6.2% in October compared to a 5.4% increase the prior month.
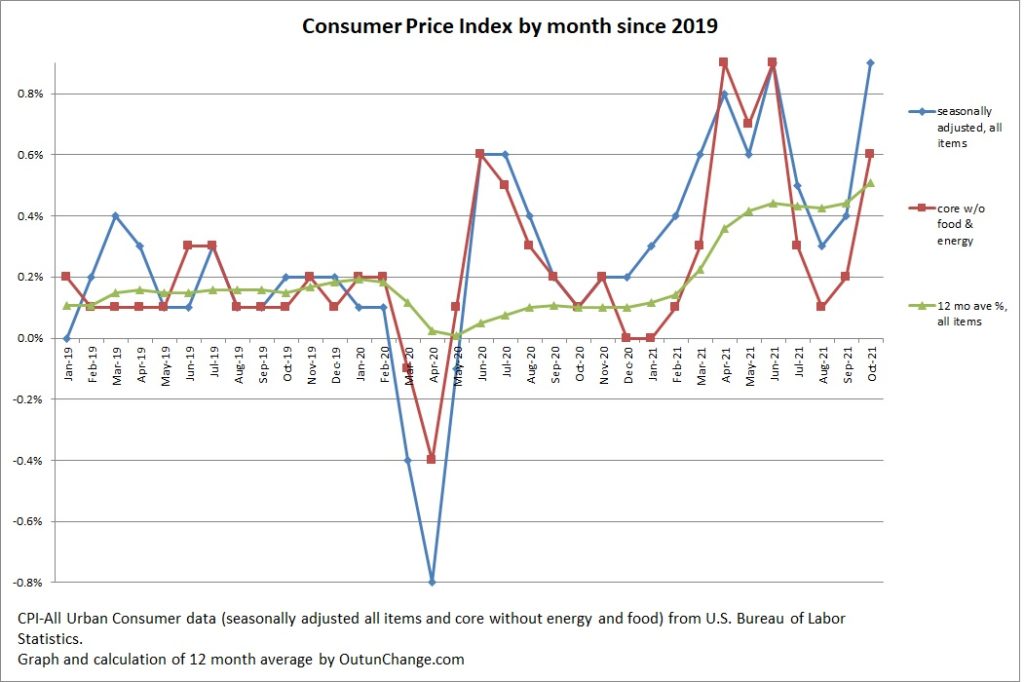
Graph at top of this post shows the monthly increase in the all-items index along with the core change, which excludes food and energy. Graph also shows an average of the preceding 12 months for the all-items indicator.
The trailing 12 month average is also grim. It shows:
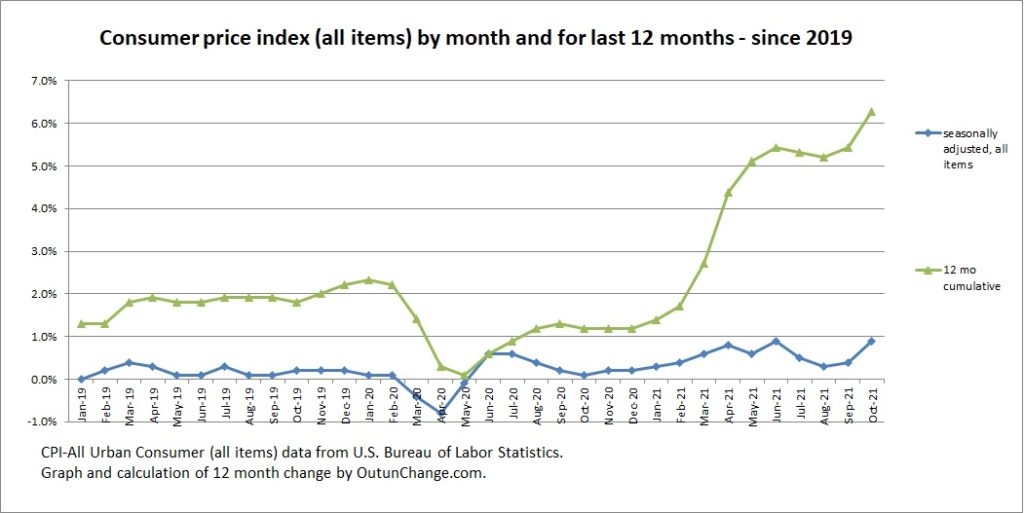
You can see a sharp rise starting in the January/February timeframe. The 12 month change had been running around 2% before the pandemic. In late 2020 it was running about 1% with rapid increase starting in 2021. For the last six months the 12 month change in CPI has been over 4% and rising.
Let’s look at what inflation rate would be if it continued for a year at the monthly change. In other words annualize the monthly increases.
Following graph shows my calculation of the monthly change in CPI, trailing three month average, and an annualization of the most recent three-month change.
The results of annualizing the three-month change:
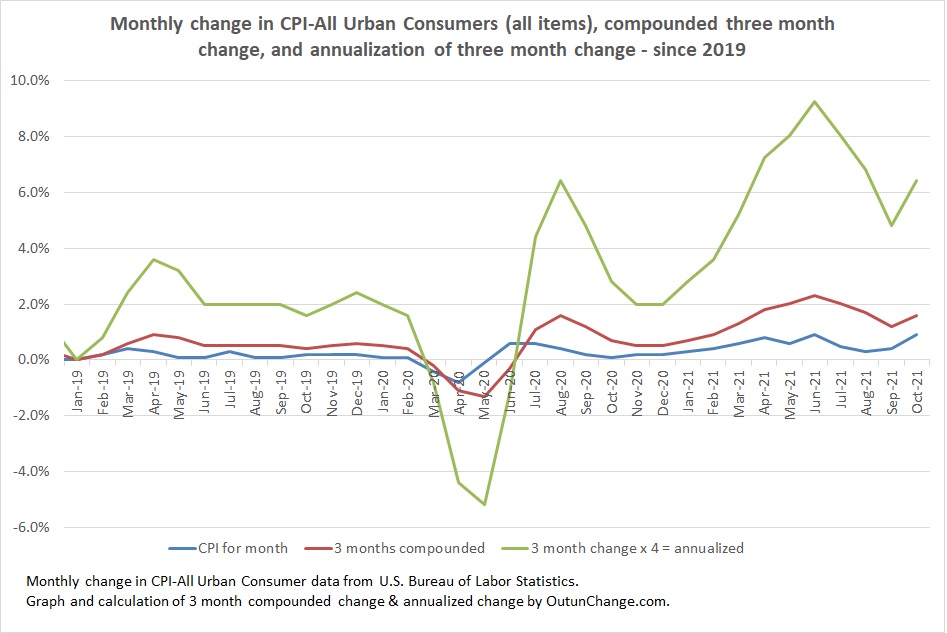
Smooth out the curve and looks like we are in the range of over 6% inflation.