Unemployment rate up slightly in April 2021 after slow decline since November 2020.

The unemployment rate skyrocketed during the pandemic heating a frightening 14.7% in April 2020, a year ago. It declined substantially, hitting 6.9% in October 2020.

Since November, he sent to the corresponding to the election, the employment rate has been slowly declining, drifting down to 6.0% in March 2021.

In April 2021, then upon rate inched up to 6.1%. This is the first monthly increase since the peak in April 2020.

To help understand the data and underlying trends, let’s dive deeper into the numbers.

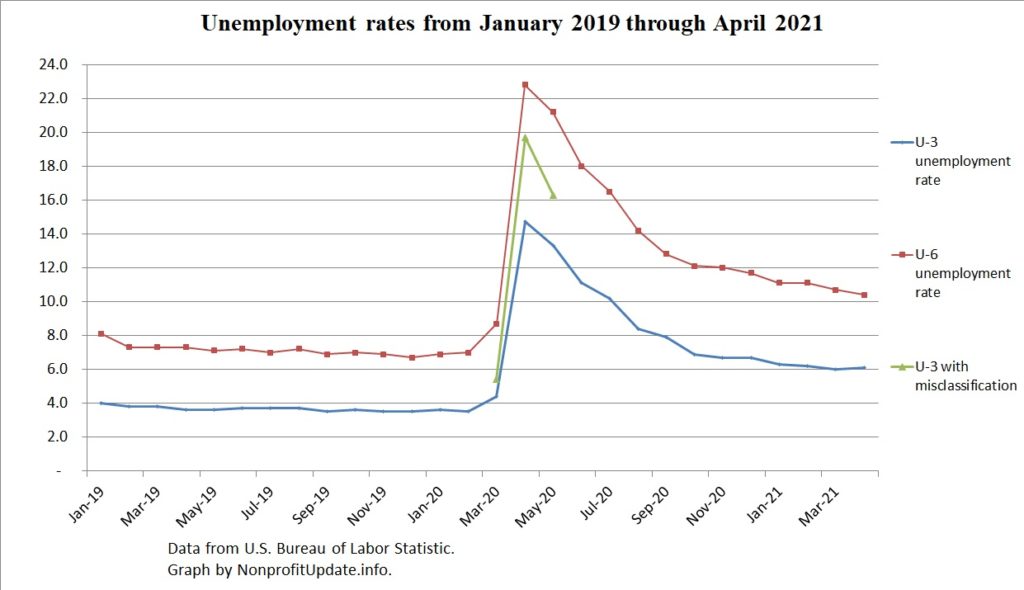
The U-3 and U-6 unemployment rates since the start of 2019 are visible in the graph at the top of this post.

General trend visible in that graph is unemployment rate has been flat at around 6% since the fall after having been at below 4% for over a year before the pandemic.

For a longer-term perspective, check out the U-3 and U-6 unemployment rates since before the Great Recession:

(more…)

Continued struggles in recovery of job market.

Lots of companies are looking for new staff but can’t find enough workers. Image courtesy of Adobe Stock.

Spending by consumers is growing while the number of new jobs is not as strong as expected and employers are having a hard time finding enough staff.

5/7/21 – Wall Street Journal – U.S. Employers Added 266,000 Jobs in April as Hiring Slowed – Expectation among economic forecasters was employers would add 1 million new jobs in April. Actual results were a mere 266,000.

This follows a downward revision to the March data.

Leisure and hospitality (that means entertainment, hotels, and motels) saw most of the growth in April. In more detail, there are 331K new jobs in those sectors which offset a net decline of 65K in all other sectors.

Article repeats the comment seen in many of other articles that employers are having a hard time attracting new staff.

(more…)

New claims for unemployment slowly decreasing at end of April 2021.

The number of new unemployment claims for week ending 4/24/21 decreased by a small 13,000 to 553,000.  That is the lowest level of newly unemployed since the start of the shutdown.

New claims dropped a lot in the week ending 4/10/21, going from 769K the prior week to 576K, a drop of 193K.

New claims in state programs at the end of the last three months:

(more…)

New claims for unemployment in week ending 3/13/21 are roughly same as last several months.

The number of new claims for unemployment for week ending 3/13/21 increased 45,000 after decling 29,000 the prior week. Those weekly changes are in the range of what has happened over the last six months. In other words, not a lot of improvement with plenty of ups and downs in the weekly new-claims tally.

Since 8/29/20, the new weekly claims ranged from a low of 711K to high of 965K. average since then is 812K. That means weekly new claims have been bad news for seven months in a row.

For context consider before the economic shutdown the new claims averaged about 220K per week, so after all these months of improvements we are still running about four times the previous norm.

Why this ongoing discussion?

If we’re going to understand what is happening in the economy we need to dive deeper into the numbers. For those of us who are CPAs providing audits and reviews, it helps us to have a deeper understanding of the overall economy.

Ponder the following graphs and you can make your own assessment.

News report

(more…)

2020 giving trends for churches and religious charities based on ECFA survey.

Image courtesy of Adobe Stock.

Finding data on prior year contribution trends early enough in the year to have analytical value in a review or audit has long been a challenge. Usable data for 2020 is now available in March. This is current enough to allow leaders in churches and ministries analyze the 2020 financial results in time for it to be actionable.

Throughout the pandemic the Evangelical Council for Financial Accountability (ECFA) has been conducting quarterly surveys of its members. Lots of data has been gathered and processed.

On 3/4/21, ECFA published the results of their survey of full year 2020 revenue and expense trends compared to 2019. They have graciously made the results of the survey available for free. You can find it on this page of Feature Surveys. Click on the “Free Download” button beneath the Remarkable Resilience survey report dated March 2021.

The survey is based on responses from 559 churches and 730 religious nonprofits. That is a total of 1,289 responses. ECFA has lots of subsectors for its membership. For those sectors with 20 or more responses, the survey aggregates and reports results.

Who would benefit from looking at this survey? Two groups.

First, finance teams and senior leadership of churches and religious nonprofits to see financial results for 2020 of a large group of their peers. This provides an incredible opportunity to see how other organizations are doing.

Second, CPAs performing reviews or audits of churches religious not-for-profit organizations can easily find industrywide information to use as a benchmark. As mentioned earlier, financial information is usually published long after most of the reviews and audits have been released. It is rare I can find anything that is actually usable.

High-level results from the ECFA survey are summarized into three broad categories:

(more…)

Large rise new claims for unemployment for week ending 1/9/21.

The number of new claims for unemployment for week ending 1/9/21 increased to 965,000, a deterioration of 181,000 from the prior week.  That is the highest number of new state claims since 8/22/20.

Since 8/29/20, the new weekly claims have been in the 700Ks or 800Ks.

Keep in mind that before the shutdown of the economy the new claims averaged about 220K per week, so we are now running more than four times the previous norm.

The number of continuing claims for unemployment has been slowly dropping but increased for the week ending 1/2/21.

News report

Article at Wall Street Journal on 1/14/21 reports US Unemployment Claims Rise as Pandemic Weighs on Economy. Article link indicates the consensus is the increasing virus count combined with increasing restrictions on businesses caused the jump in new unemployment claims.

Article says there are other economic indicators suggesting the economy is slowing down again. Stats such as small business optimism, new home sales, existing home sales, household income, and household spending point towards a slowdown.

Following graphs show the devastation from the economic shutdown.

New claims

New claims for unemployment by week since the start of 2020:

(more…)