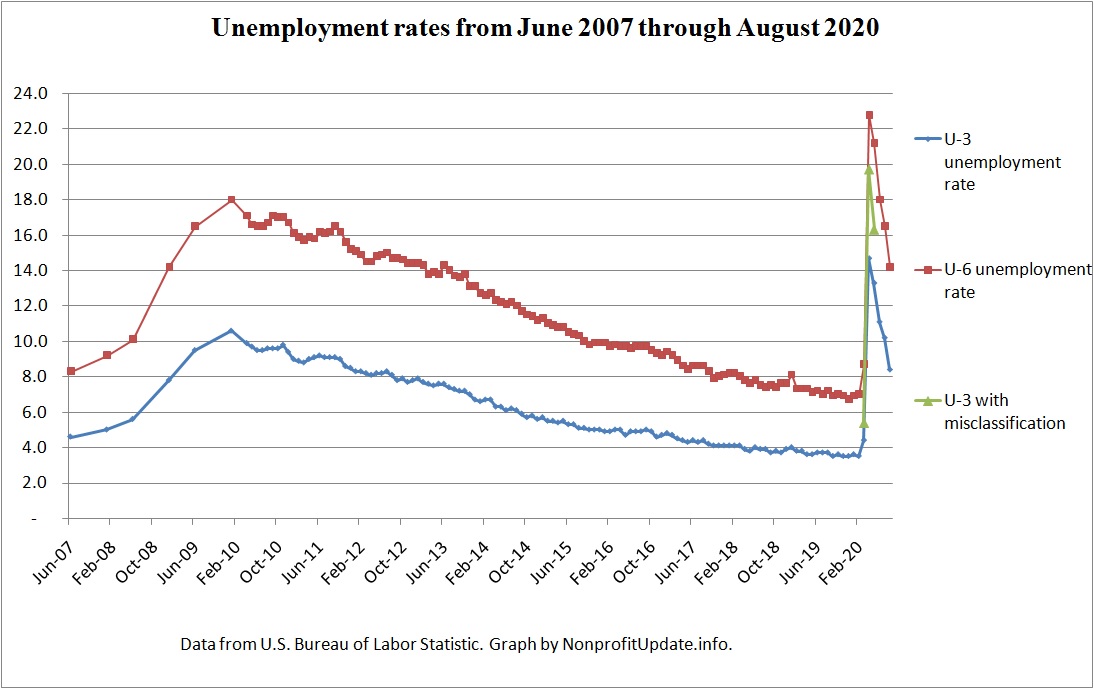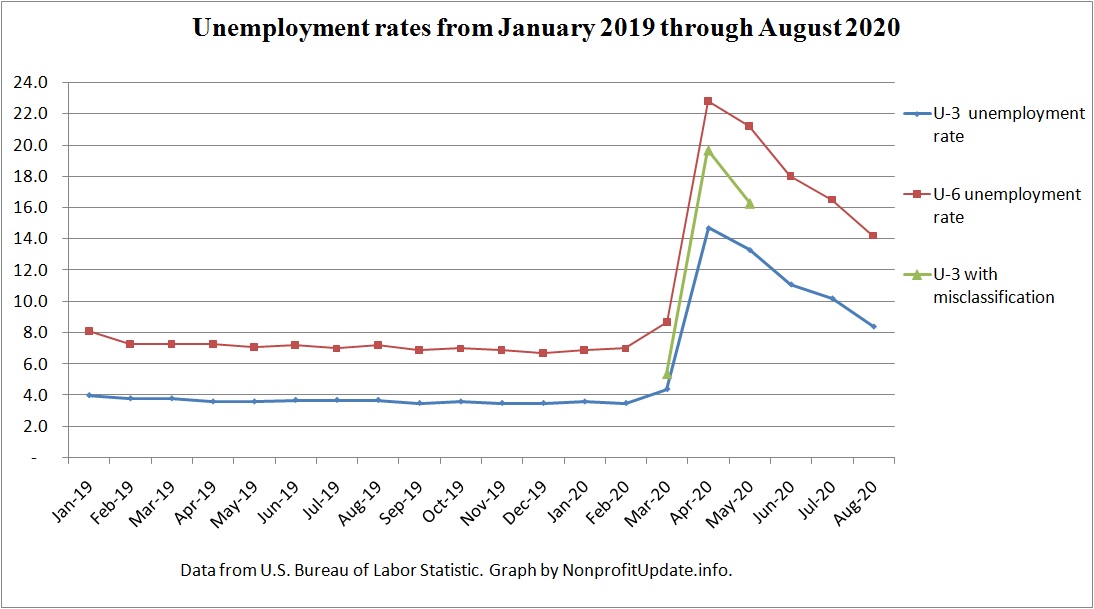
After shooting from 3.4% in February to 14.7% in April, the headline unemployment rate has dropped to 8.4% in August.
You will interpret the statistics as you wish.
Looks to me like people are slowing getting back to work after the shock of the pandemic and follow-on government-ordered shutdown of the economy.
There are six different measures of unemployment, each providing a slightly different perspective. Put them all together for a more complex picture the economy.
At the top is a graph since 2007 of U-3, the headline statistic, along with U-6, the broadest stat which includes discouraged workers, marginally attached, and those working part time because they can’t find full time work.
For a closer picture, focus in on the stats since January 2019:

Here are the raw numbers for U-1 through U-6:
| measure | Feb 20 | Mar 20 | Apr 20 | May 20 | Jun 20 | Jun 21 | Jun 22 |
| U-1 | 1.2 | 1.2 | 1.1 | 1.4 | 2.1 | 5.0 | 5.1 |
| U-2 | 1.7 | 2.4 | 13.2 | 11.6 | 8.9 | 8.1 | 6.4 |
| U-3 | 3.5 | 4.4 | 14.7 | 13.3 | 11.1 | 10.2 | 8.4 |
| U-4 | 3.8 | 4.7 | 15.1 | 13.6 | 11.5 | 10.6 | 8.7 |
| U-5 | 4.4 | 5.2 | 16.0 | 14.6 | 12.5 | 11.3 | 9.6 |
| U-6 | 7.0 | 8.7 | 22.8 | 21.2 | 18.0 | 16.5 | 14.2 |
Notice the U-1, which is the long-term unemployed stat, rose 0.7% in June and then shot up another 2.9% in June.
Changes since April:
- U-1 – up 4.0%
- U-3 – down 6.3%
- U-6 – down 8.6%
Explanation of the different stats:
| measure | description |
| U-1 | U-1 Persons unemployed 15 weeks or longer, as a percent of the civilian labor force |
| U-2 | U-2 Job losers and persons who completed temporary jobs, as a percent of the civilian labor force |
| U-3 | U-3 Total unemployed, as a percent of the civilian labor force (official unemployment rate) |
| U-4 | U-4 Total unemployed plus discouraged workers, as a percent of the civilian labor force plus discouraged workers |
| U-5 | U-5 Total unemployed, plus discouraged workers, plus all other persons marginally attached to the labor force, as a percent of the civilian labor force plus all persons marginally attached to the labor force (i.e. marginally attached) |
| U-6 | U-6 Total unemployed, plus all persons marginally attached to the labor force, plus total employed part time for economic reasons, as a percent of the civilian labor force plus all persons marginally attached to the labor force |