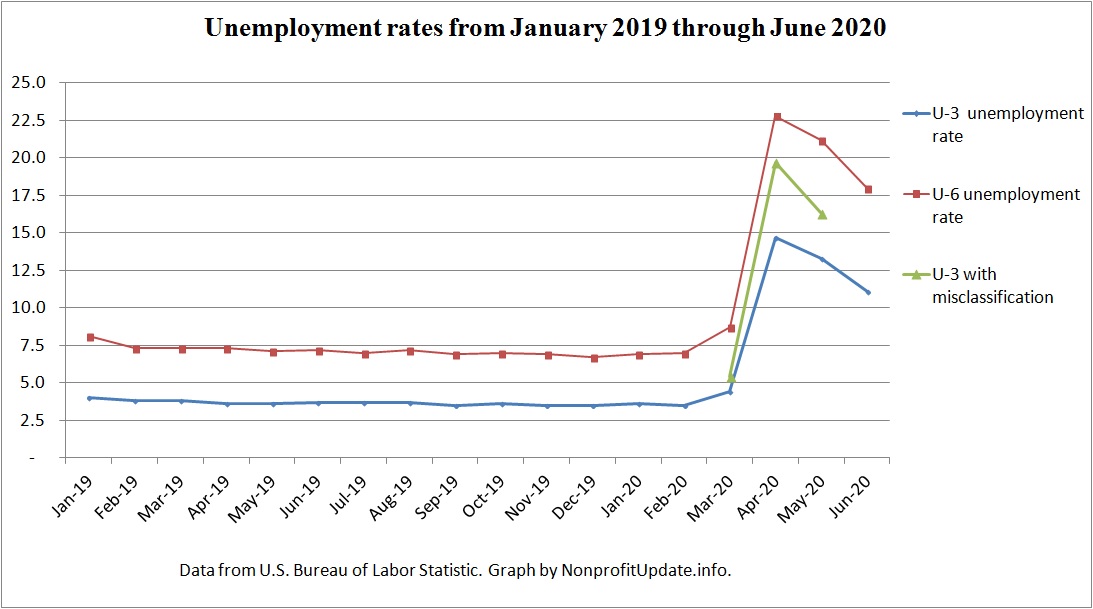
Wow, I sure don’t understand what is happening. The headline unemployment rate declined 2.2% in June. That is a big drop.
At the same time, new claims for unemployment were 6.01 million for the four weeks ending 6/27/20. See previous post: New unemployment claims barely decline in week ending 6/27/20.
(How to put that information together? Well, the reason I’m blogging is to put my thoughts into writing, which forces me to think deeper in order to sort out what is going on around me.)
The U-3 unemployment rate in last four months with change from previous month:
| march | 4.4 | |
| april | 14.7 | 10.3 |
| may | 13.3 | (1.4) |
| june | 11.1 | (2.2) |
That is a 2.6% drop in two months after a 10.3% rise in April.
Wow.
Graph above shows key unemployment rates since the start of 2019.
This discussion will be posted at several of my blogs.
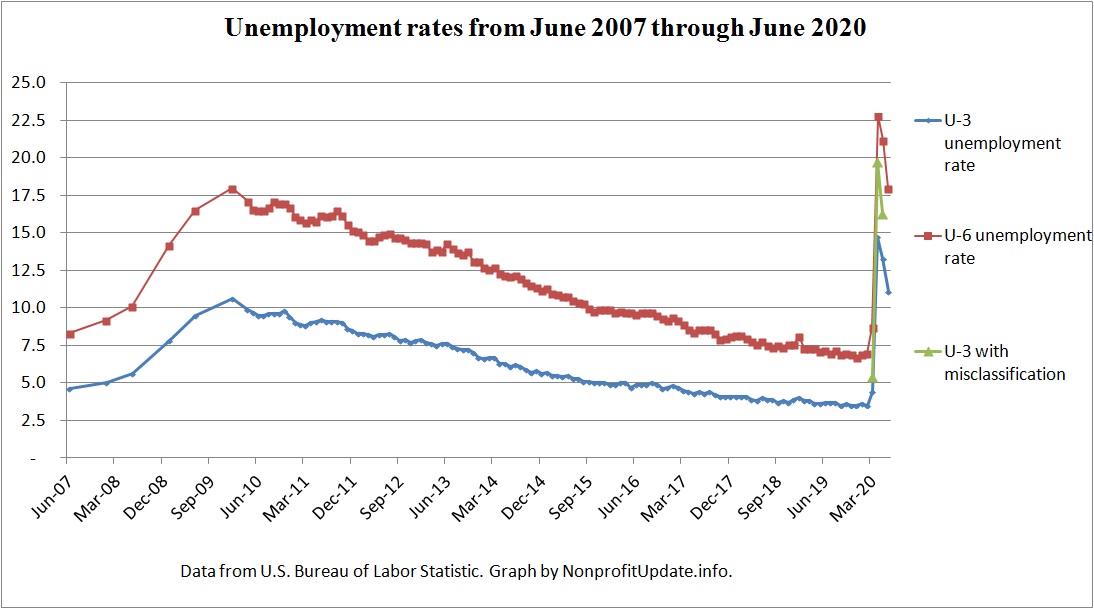
For longer term perspective, consider the rates since before the Great Recession:

The only way I can fit this drop in the unemployment rate with the severe number of new claims for unemployment is to factor in the number of new jobs being created. It appears there is a rapid expansion in the number of jobs leading to the drop in unemployment.
7/2/20 – CNBC – Record jobs gain of 4.8 million in June smashes expectations; unemployment rate falls to 11.1% – Incredibly and surprisingly, nonfarm payroll jobs rose by 4.8M during the month. The expectation had been only 2.9M. consensus was for a 12.4% U-3 unemployment rate instead of the 11.1% actual. Revised calculation of new jobs in May is 2.7M.
Putting the information together suggests the economy is likely making a rapid recovery.
Measures of unemployment in recent months
Official measures of the unemployment rate since the start of the economic shutdown:
| measure | Feb 20 | Mar 20 | Apr 20 | May 20 | Jun 20 |
| U-1 | 1.2 | 1.2 | 1.1 | 1.4 | 2.1 |
| U-2 | 1.7 | 2.4 | 13.2 | 11.6 | 8.9 |
| U-3 | 3.5 | 4.4 | 14.7 | 13.3 | 11.1 |
| U-4 | 3.8 | 4.7 | 15.1 | 13.6 | 11.5 |
| U-5 | 4.4 | 5.2 | 16.0 | 14.6 | 12.5 |
| U-6 | 7.0 | 8.7 | 22.8 | 21.2 | 18.0 |
Explanation of the Six Different Measures Of Unemployment used by The U.S. Bureau Of Labor Statistics:
| U-1 Persons unemployed 15 weeks or longer, as a percent of the civilian labor force |
| U-2 Job losers and persons who completed temporary jobs, as a percent of the civilian labor force |
| U-3 Total unemployed, as a percent of the civilian labor force (official unemployment rate) |
| U-4 Total unemployed plus discouraged workers, as a percent of the civilian labor force plus discouraged workers |
| U-5 Total unemployed, plus discouraged workers, plus all other persons marginally attached to the labor force, as a percent of the civilian labor force plus all persons marginally attached to the labor force (i.e. marginally attached) |
| U-6 Total unemployed, plus all persons marginally attached to the labor force, plus total employed part time for economic reasons, as a percent of the civilian labor force plus all persons marginally attached to the labor force |
The U-3 stat is routinely referred to as the official unemployment rate. That is the measure everyone talks about.
Misclassification error in data understates unemployment
The graphs above include a third line, reflecting the number of people which are answering the Department of Labor’s survey in such a way that the department would otherwise count them is unemployed but the answer provided in the past has counted as employed.
As I mentioned before, the Labor Department reported that if the misclassification error were corrected, the U3 unemployment rate would increase by:
- 1% – March 2020
- 5% – April
- 4% – May
To maintain consistency in methodology, and more importantly avoid charges of fudging the numbers, the Labor Department has not corrected for the methodological error.