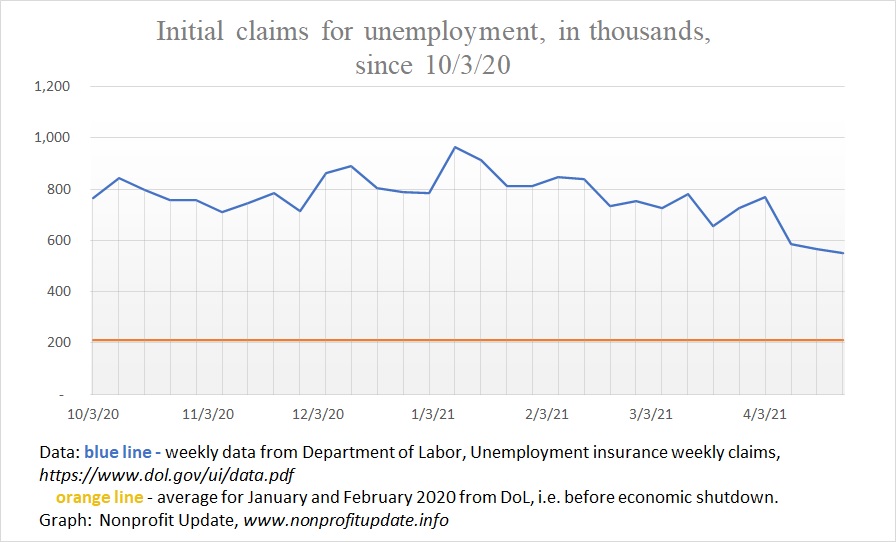
The number of new unemployment claims for week ending 4/24/21 decreased by a small 13,000 to 553,000. That is the lowest level of newly unemployed since the start of the shutdown.
New claims dropped a lot in the week ending 4/10/21, going from 769K the prior week to 576K, a drop of 193K.
New claims in state programs at the end of the last three months:
- 754K – 2/27/21
- 728K – 3/27/221
- 553K – 4/24/21
Since 8/29/20, the new weekly claims ranged from a low of 553K to high of 965K. Average since then is 784K.
For context, consider that before the economic shutdown the new claims averaged about 220K per week, so for the last 35 weeks (about 8 months) we have been running just under four times the previous norm.
Following graphs show the devastation from the economic shutdown.
New claims
New claims for unemployment by week since the start of 2020:

Top of this post shows a graph looking closer at the new claims since 10/3/20.
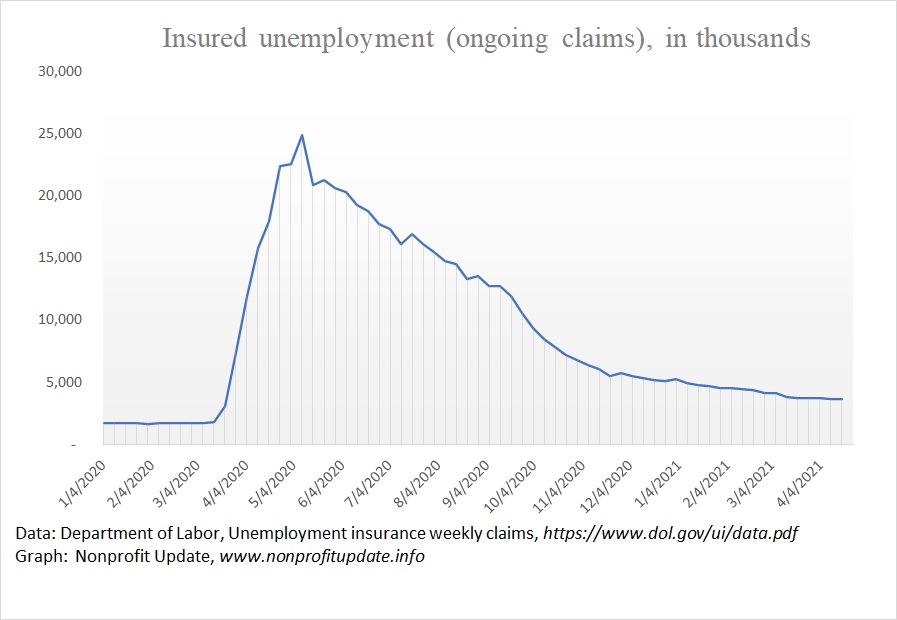
Continuing claims
The number of people covered by unemployment insurance who are drawing checks is extremely high, but is continuing to drop, even if slowly. This is labeled as the number of insured unemployed. People going into the extended benefits program at the federal level offset a large portion of the drop.
Continuing claims at state level since start of 2020:
A closer look at the continuing claims at the state level only since 10/3/20:
Notice the relatively flat line up until the last three weeks and the distance between the last seven months and the normal claim levels before the shutdown.
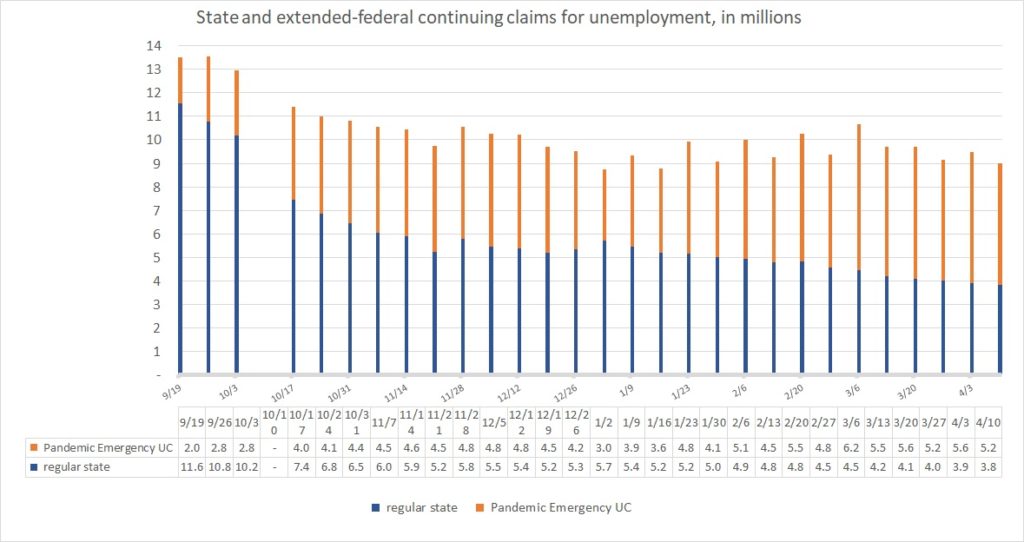
Continuing claims in state and federal programs
When people exhaust the state level coverage, they become eligible for the extended federal benefits, called the Pandemic Emergency Unemployment Compensation program.
Tally of people who are now in the extended 13 weeks covered at the federal level is offsetting a portion of the drop in state-level. The number of total covered unemployed is dropping only slowly.
Looking at the following graph shows what could be called a ‘trading range’, with fluctuations between 8.8M and 10.7M in the last six months since 11/7/20.
Graph of state coverage and extended federal coverage:
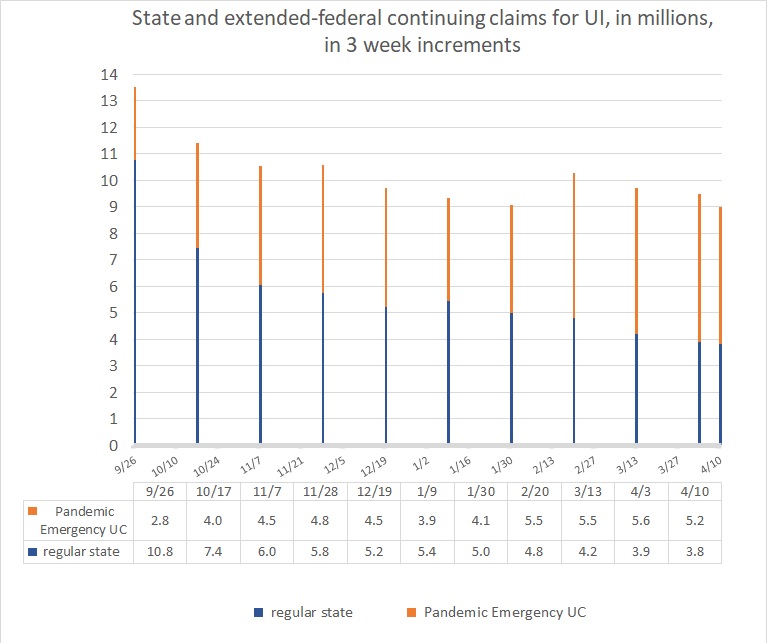
To provide a clearer picture of the trend, let’s look at the combined federal and state ongoing claims in three week increments:
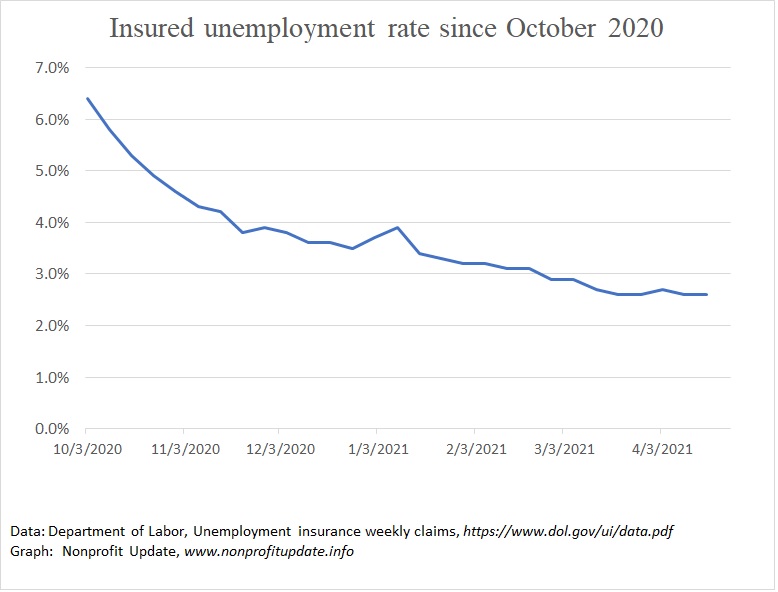
Insured unemployment rate
The proportion of people who are covered by unemployment insurance who are unemployed is also included in the weekly report. As you can see the insured unemployment rate is continuing to drop.

For a closer look, check out the insured unemployment rate since the start of October 2020:
Data source
Weekly press release from the Department of labor: Unemployment insurance weekly claims. At the end of the report you can find weekly data for this year. Page 4 has a table containing all the numbers I extracted for weekly update to these tables.