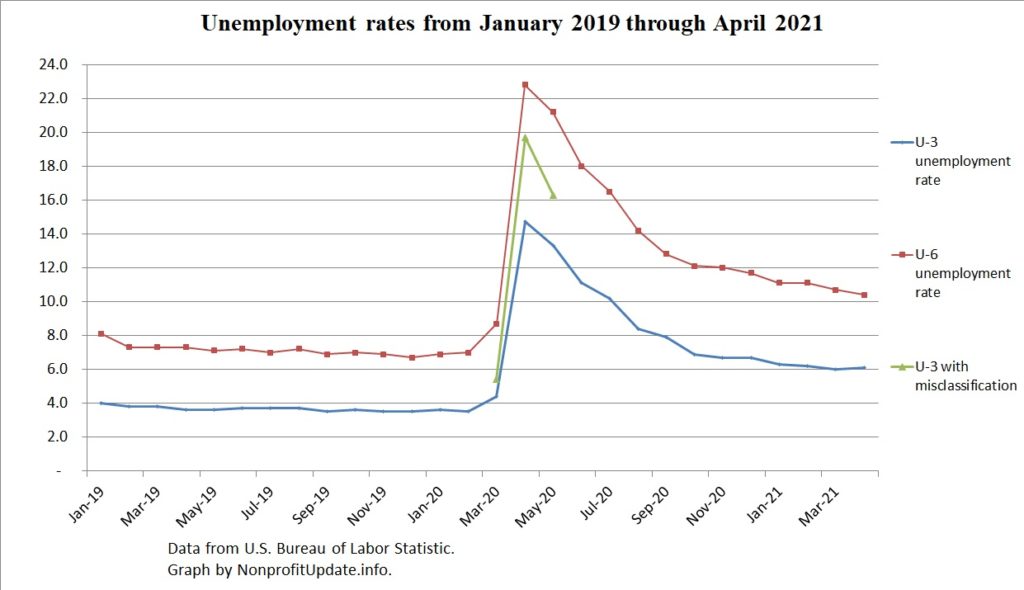
The unemployment rate skyrocketed during the pandemic heating a frightening 14.7% in April 2020, a year ago. It declined substantially, hitting 6.9% in October 2020.
Since November, he sent to the corresponding to the election, the employment rate has been slowly declining, drifting down to 6.0% in March 2021.
In April 2021, then upon rate inched up to 6.1%. This is the first monthly increase since the peak in April 2020.
To help understand the data and underlying trends, let’s dive deeper into the numbers.
The U-3 and U-6 unemployment rates since the start of 2019 are visible in the graph at the top of this post.
General trend visible in that graph is unemployment rate has been flat at around 6% since the fall after having been at below 4% for over a year before the pandemic.
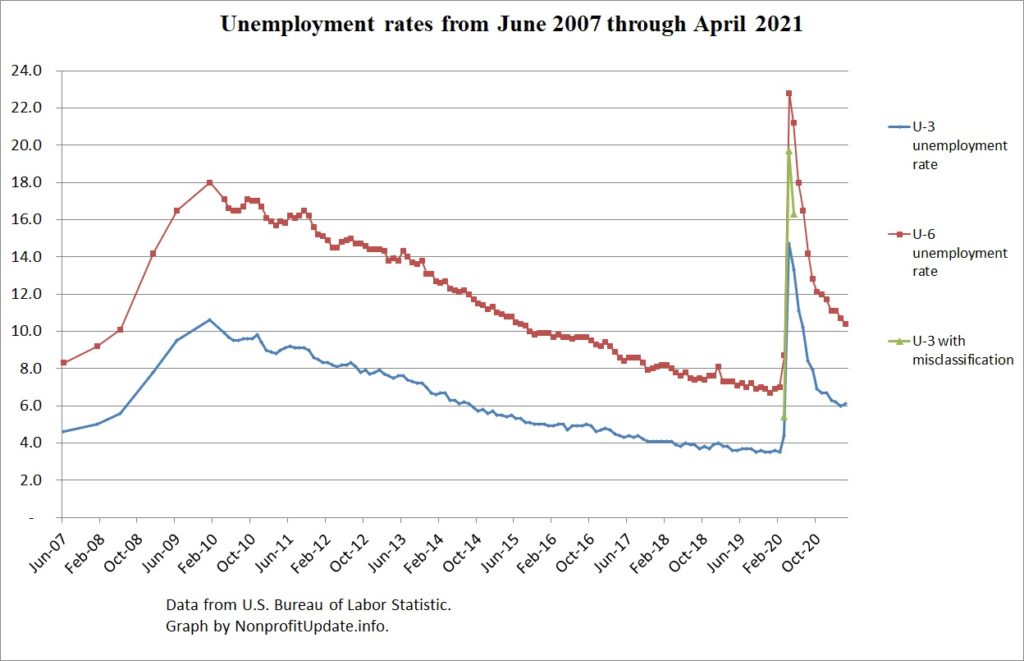
For a longer-term perspective, check out the U-3 and U-6 unemployment rates since before the Great Recession:

For numerical indicators, here are the U-1 through U-6 measures at the peak of April 2020 and for the last four months. There is a dramatic drop but in the last four months the U-3 has been rather flat:
| measure | Apr 20 | Jan 21 | Feb 21 | Mar 21 | Apr 21 |
| U-1 | 1.1 | 3.4 | 3.5 | 3.5 | 3.3 |
| U-2 | 13.2 | 4.4 | 4.1 | 3.9 | 4.0 |
| U-3 | 14.7 | 6.3 | 6.2 | 6.0 | 6.1 |
| U-4 | 15.1 | 6.7 | 6.5 | 6.4 | 6.4 |
| U-5 | 16.0 | 7.4 | 7.3 | 7.1 | 7.2 |
| U-6 | 22.8 | 11.1 | 11.1 | 10.7 | 10.4 |
The six different indicators each major a slightly different factor ranging from the long-term unemployed at U-1 through the U-6 includes discouraged workers and people marginally attached to the labor force. The specific definitions:
| U-1 Persons unemployed 15 weeks or longer, as a percent of the civilian labor force |
| U-2 Job losers and persons who completed temporary jobs, as a percent of the civilian labor force |
| U-3 Total unemployed, as a percent of the civilian labor force (official unemployment rate) |
| U-4 Total unemployed plus discouraged workers, as a percent of the civilian labor force plus discouraged workers |
| U-5 Total unemployed, plus discouraged workers, plus all other persons marginally attached to the labor force, as a percent of the civilian labor force plus all persons marginally attached to the labor force (i.e. marginally attached) |
| U-6 Total unemployed, plus all persons marginally attached to the labor force, plus total employed part time for economic reasons, as a percent of the civilian labor force plus all persons marginally attached to the labor force |