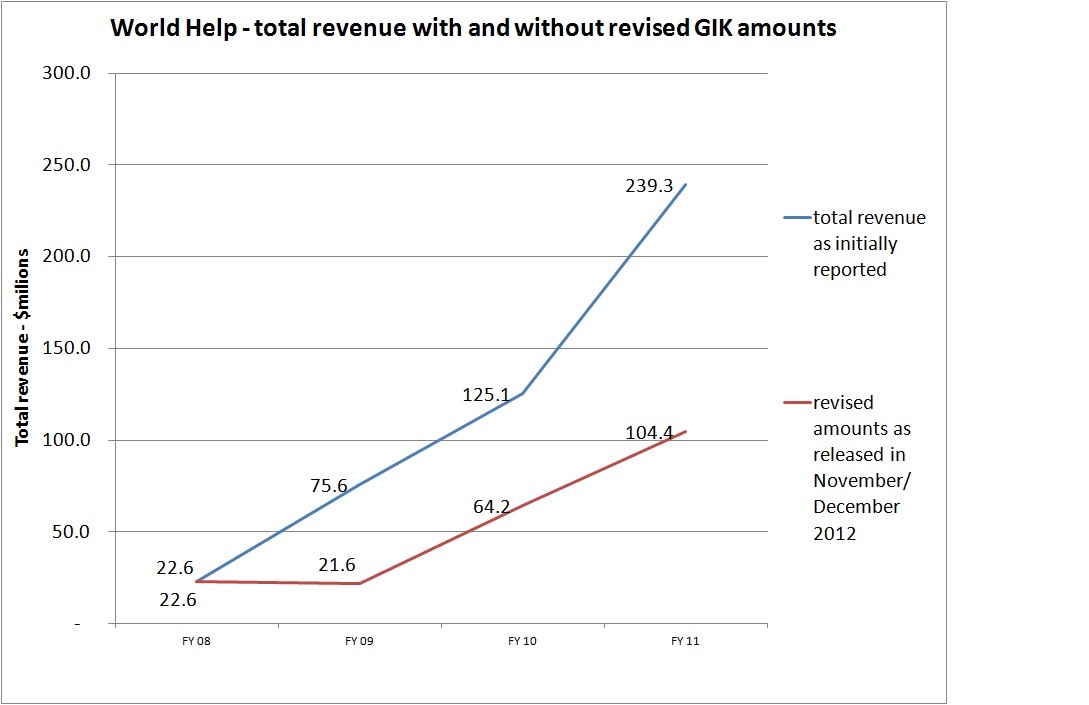
Shortly after World Help posted revised financial statements for 2011 and 2010, it posted revised revenue numbers for 2009. After going over the revised numbers, I’ll show a graph tracing their total revenue over the last four years.
The revised 2009 information is visible in the audited financial statements for 2010/2009. You can find the page with World Help’s financial reports here. You can click directly to the 2010/2009 audited financial statements here.
The revised audit opinion is dated December 3, 2012. ‘Properties’ information in the PDF file of the financial statements indicate the file was created December 4, so my guess would be that is the date the revised financials were posted.
Here is the amount of gifts in kind revenue from the original financial statements and as revised. The 2008 report did not break out the amount of revenue between cash and GIK.
| original | revised | change | |
| 2008 | – | ||
| 2009 | 64,802,960 | 10,788,687 | (54,014,273) |
| 2010 | 108,563,274 | 47,626,590 | (60,936,684) |
| 2011 | 223,657,860 | 88,724,073 | (134,933,787) |
| —– | —– | —– | |
| 397,024,094 | 147,139,350 | (249,884,744) |
Here is the total revenue for the last four years:
| original | revised | change | |
| FY 08 | 22,611,097 | 22,611,097 | – |
| FY 09 | 75,565,108 | 21,550,835 | (54,014,273) |
| FY 10 | 125,119,444 | 64,182,760 | (60,936,684) |
| FY 11 | 239,334,459 | 104,400,672 | (134,933,787) |
| —– | —– | —– | |
| 462,630,108 | 212,745,364 | (249,884,744) |
That is a $250 million drop in GIK over three years.
I graphed the total revenue for 2008 through 2011 before and after revisions of the GIK amounts. Here is the trend info:

Previous posts can be found here.
One thought on “Revised 2009 revenue for World Help and graph of revenue for last 4 years”